Category: Uncategorized

  • VITAMIN E

    Fact Sheet for Health Professionals

    Have a question? Ask ODS
    Join the ODS Email List

    Table of Contents

    This is a fact sheet intended for health professionals. For a reader-friendly overview of Vitamin E, see our consumer fact sheet on Vitamin E.

    Introduction

    Vitamin E is found naturally in some foods, added to others, and available as a dietary supplement. “Vitamin E” is the collective name for a group of fat-soluble compounds with distinctive antioxidant activities [1].

    Naturally occurring vitamin E exists in eight chemical forms (alpha-, beta-, gamma-, and delta-tocopherol and alpha-, beta-, gamma-, and delta-tocotrienol) that have varying levels of biological activity [1]. Alpha- (or α-) tocopherol is the only form that is recognized to meet human requirements.

    Serum concentrations of vitamin E (alpha-tocopherol) depend on the liver, which takes up the nutrient after the various forms are absorbed from the small intestine. The liver preferentially resecretes only alpha-tocopherol via the hepatic alpha-tocopherol transfer protein [1]; the liver metabolizes and excretes the other vitamin E forms [2]. As a result, blood and cellular concentrations of other forms of vitamin E are lower than those of alpha-tocopherol and have been the subjects of less research [3,4].

    WHAT ARE ANTIOXIDANTS

    Antioxidants protect cells from the damaging effects of free radicals, which are molecules that contain an unshared electron. Free radicals damage cells and might contribute to the development of cardiovascular disease and cancer [5]. Unshared electrons are highly energetic and react rapidly with oxygen to form reactive oxygen species (ROS). The body forms ROS endogenously when it converts food to energy, and antioxidants might protect cells from the damaging effects of ROS. The body is also exposed to free radicals from environmental exposures, such as cigarette smoke, air pollution, and ultraviolet radiation from the sun. ROS are part of signaling mechanisms among cells.

    Vitamin E is a fat-soluble antioxidant that stops the production of ROS formed when fat undergoes oxidation. Scientists are investigating whether, by limiting free-radical production and possibly through other mechanisms, vitamin E might help prevent or delay the chronic diseases associated with free radicals.

    IMMUNE FUNCTION

    In addition to its activities as an antioxidant, vitamin E is involved in immune function and, as shown primarily by in vitro studies of cells, cell signaling, regulation of gene expression, and other metabolic processes [1]. Alpha-tocopherol inhibits the activity of protein kinase C, an enzyme involved in cell proliferation and differentiation in smooth muscle cells, platelets, and monocytes [6]. Vitamin-E–replete endothelial cells lining the interior surface of blood vessels are better able to resist blood-cell components adhering to this surface. Vitamin E also increases the expression of two enzymes that suppress arachidonic acid metabolism, thereby increasing the release of prostacyclin from the endothelium, which, in turn, dilates blood vessels and inhibits platelet aggregation [6].

    Recommended Intakes

    Intake recommendations for vitamin E and other nutrients are provided in the Dietary Reference Intakes (DRIs) developed by the Food and Nutrition Board (FNB) at the Institute of Medicine of The National Academies (formerly National Academy of Sciences) [6]. DRI is the general term for a set of reference values used to plan and assess nutrient intakes of healthy people. These values, which vary by age and gender, include:

    • Recommended Dietary Allowance (RDA): Average daily level of intake sufficient to meet the nutrient requirements of nearly all (97%–98%) healthy individuals; often used to plan nutritionally adequate diets for individuals.
    • Adequate Intake (AI): Intake at this level is assumed to ensure nutritional adequacy; established when evidence is insufficient to develop an RDA.
    • Estimated Average Requirement (EAR): Average daily level of intake estimated to meet the requirements of 50% of healthy individuals; usually used to assess the nutrient intakes of groups of people and to plan nutritionally adequate diets for them; can also be used to assess the nutrient intakes of individuals.
    • Tolerable Upper Intake Level (UL): Maximum daily intake unlikely to cause adverse health effects.

    The FNB’s vitamin E recommendations are for alpha-tocopherol alone, the only form maintained in plasma. The FNB based these recommendations primarily on serum levels of the nutrient that provide adequate protection in a test measuring the survival of erythrocytes when exposed to hydrogen peroxide, a free radical [6]. Acknowledging “great uncertainties” in these data, the FNB has called for research to identify other biomarkers for assessing vitamin E requirements.

    Naturally sourced vitamin E is called RRR-alpha-tocopherol (commonly labeled as d-alpha-tocopherol); the synthetically produced form is all rac-alpha-tocopherol (commonly labeled as dl-alpha-tocopherol).

    RDAs for vitamin E are provided in milligrams (mg) and are listed in Table 1. One mg vitamin E (alpha-tocopherol) is equivalent to 1 mg RRR-alpha-tocopherol or 2 mg all rac-alpha-tocopherol. Because insufficient data are available to develop RDAs for infants, AIs were developed based on the amount of vitamin E consumed by healthy breastfed babies.

    AgeMalesFemalesPregnancyLactation
    0–6 months*4 mg4 mg
    7–12 months*5 mg5 mg
    1–3 years6 mg6 mg
    4–8 years7 mg7 mg
    9–13 years11 mg11 mg
    14+ years15 mg15 mg15 mg19 mg


    *Adequate Intake (AI)

    International Units and Milligrams

    Vitamin E is listed on the new Nutrition Facts and Supplement Facts labels in mg [7]. The U.S. Food and Drug Administration (FDA) required manufacturers to use these new labels starting in January 2020, but companies with annual sales of less than $10 million may continue to use the old labels that list vitamin E in international units (IUs) until January 2021 [8]. Conversion rules are as follows:

    • To convert from mg to IU:1 mg of alpha-tocopherol is equivalent to 1.49 IU of the natural form or 2.22 IU of the synthetic form.
    • To convert from IU to mg:1 IU of the natural form is equivalent to 0.67 mg of alpha-tocopherol.1 IU of the synthetic form is equivalent to 0.45 mg of alpha-tocopherol.

    For example, 15 mg of natural alpha-tocopherol would equal 22.4 IU (15 mg x 1.49 IU/mg = 22.4 IU). The corresponding value for synthetic alpha-tocopherol would be 33.3 IU (15 mg x 2.22 IU/mg).

    Sources of Vitamin E

    Food

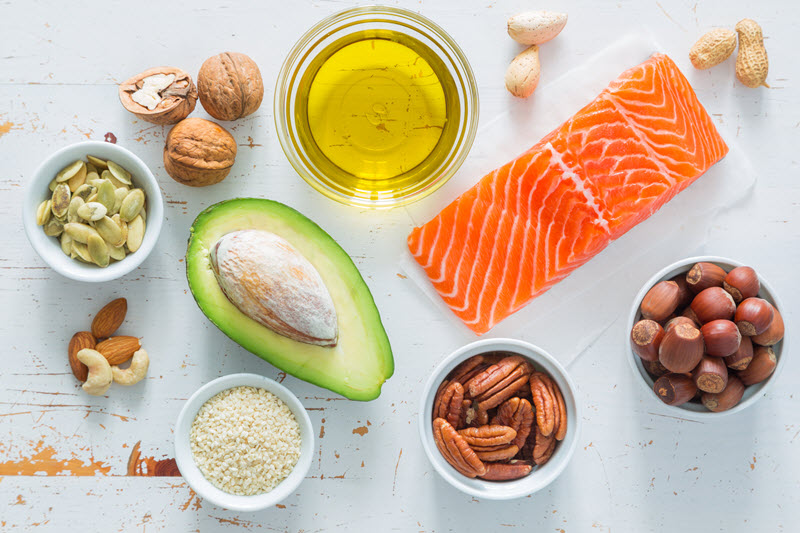
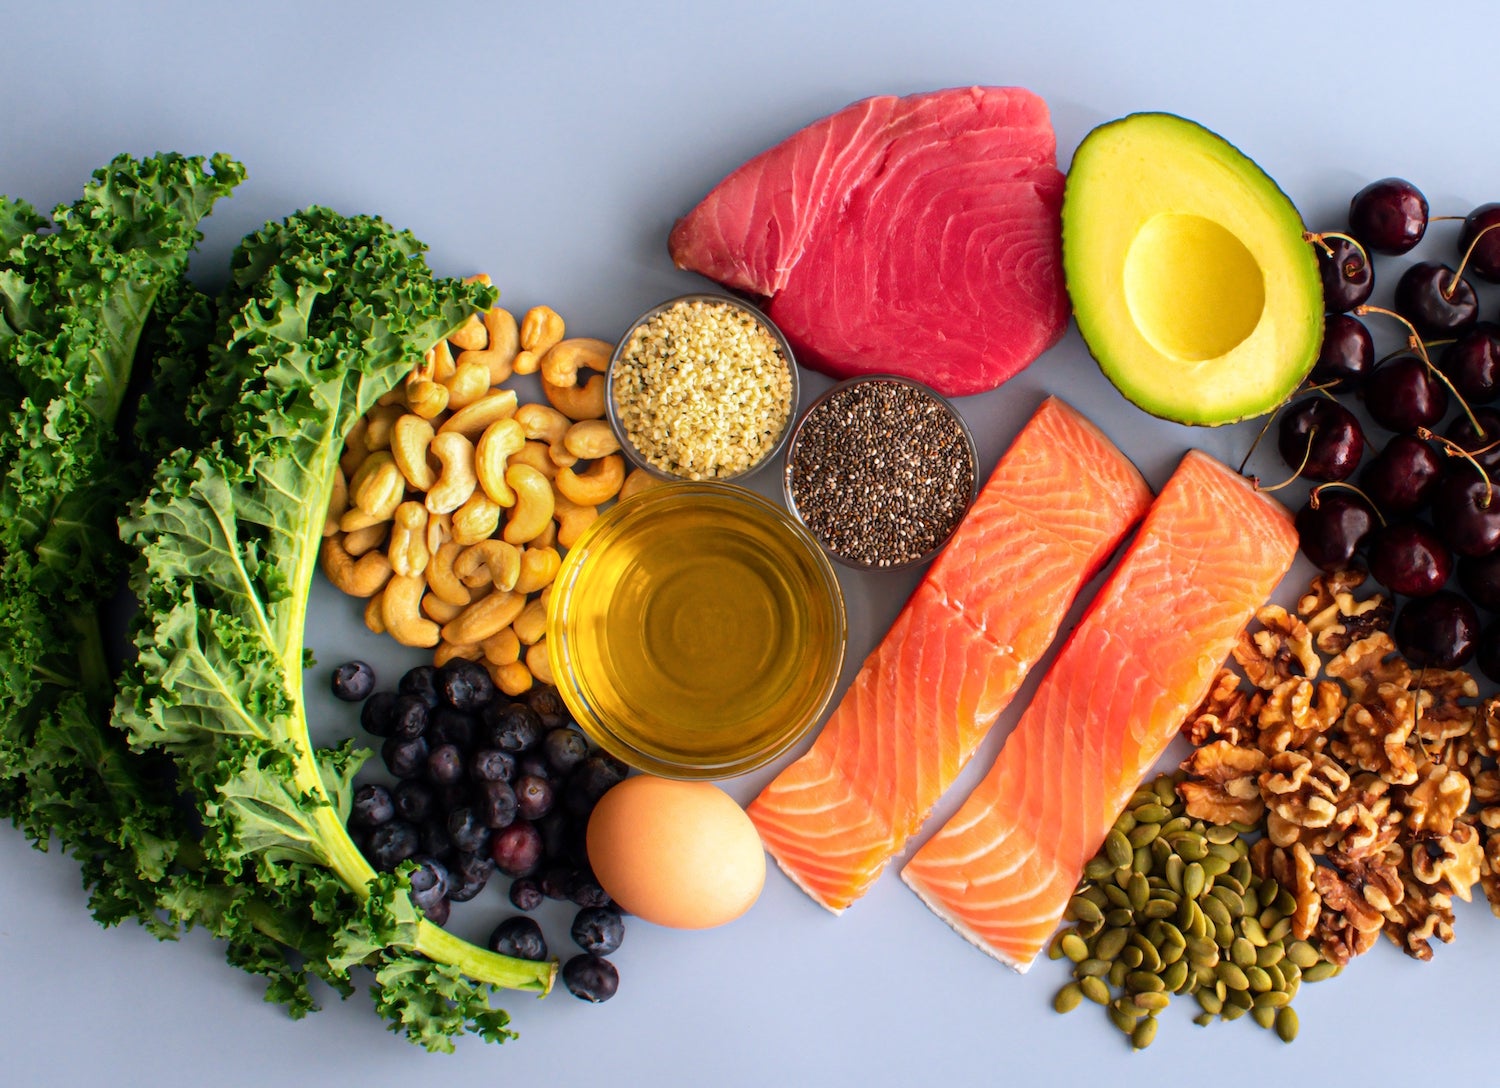
    Numerous foods provide vitamin E. Nuts, seeds, and vegetable oils are among the best sources of alpha-tocopherol, and significant amounts are available in green leafy vegetables and fortified cereals (see Table 2 for a more detailed list) [9]. Most vitamin E in American diets is in the form of gamma-tocopherol from soybean, canola, corn, and other vegetable oils and food products [4].

    FoodMilligrams (mg)
    per serving
    Percent DV*
    Wheat germ oil, 1 tablespoon20.3135
    Sunflower seeds, dry roasted, 1 ounce7.449
    Almonds, dry roasted, 1 ounce6.845
    Sunflower oil, 1 tablespoon5.637
    Safflower oil, 1 tablespoon4.631
    Hazelnuts, dry roasted, 1 ounce4.329
    Peanut butter, 2 tablespoons2.919
    Peanuts, dry roasted, 1 ounce2.215
    Corn oil, 1 tablespoon1.913
    Spinach, boiled, ½ cup1.913
    Broccoli, chopped, boiled, ½ cup1.28
    Soybean oil, 1 tablespoon1.17
    Kiwifruit, 1 medium1.17
    Mango, sliced, ½ cup0.75
    Tomato, raw, 1 medium0.75
    Spinach, raw, 1 cup0.64


    *DV = Daily Value. FDA developed DVs to help consumers compare the nutrient contents of foods and dietary supplements within the context of a total diet. The DV for vitamin E is 15 mg for adults and children age 4 years and older [7]. 1 mg vitamin E = 1 mg RRR-alpha-tocopherol = 2 mg all rac-alpha-tocopherol. FDA does not require food labels to list vitamin E content unless vitamin E has been added to the food. Foods providing 20% or more of the DV are considered to be high sources of a nutrient, but foods providing lower percentages of the DV also contribute to a healthful diet.

    The U.S. Department of Agriculture’s (USDA’s) FoodData Central website lists the nutrient content of many foods, including, in some cases, the amounts of alpha-, beta-, gamma-, and delta-tocopherol. The USDA also provides a comprehensive list of foods containing vitamin E arranged by nutrient content and by food name.

    Dietary supplements

    Supplements of vitamin E typically provide only alpha-tocopherol, although “mixed” products containing other tocopherols and even tocotrienols are available. Naturally occurring alpha-tocopherol exists in one stereoisomeric form. In contrast, synthetically produced alpha-tocopherol contains equal amounts of its eight possible stereoisomers; serum and tissues maintain only four of these stereoisomers [6]. A given amount of synthetic alpha-tocopherol (all rac-alpha-tocopherol; commonly labeled as “DL” or “dl”) is therefore only half as active as the same amount (by weight in mg) of the natural form (RRR-alpha-tocopherol; commonly labeled as “D” or “d”).

    Most vitamin-E-only supplements provide ≥67 mg (100 IU of natural vitamin E) of the nutrient. These amounts are substantially higher than the RDAs.

    Alpha-tocopherol in dietary supplements and fortified foods is often esterified to prolong its shelf life while protecting its antioxidant properties. The body hydrolyzes and absorbs these esters (alpha-tocopheryl acetate and succinate) as efficiently as alpha-tocopherol [6].

    Vitamin E Intakes and Status

    Three national surveys—the 2001–2002 National Health and Nutrition Examination Survey (NHANES) [10], NHANES III (1988–1994) [10], and the Continuing Survey of Food Intakes by Individuals (1994–1996) [11]—have found that the diets of most Americans provide less than the RDA levels of vitamin E. These intake estimates might be low, however, because the amounts and types of fat added during cooking are often unknown and not accounted for [6].

    The FNB suggests that mean intakes of vitamin E among healthy adults are probably higher than the RDA but cautions that low-fat diets might provide insufficient amounts unless people make their food choices carefully by, for example, increasing their intakes of nuts, seeds, fruits, and vegetables [6,10]. The 1999–2000 NHANES found that 11.3% of adults took vitamin E supplements containing at least 400 IU [12].

    Vitamin E Deficiency

    Frank vitamin E deficiency is rare and overt deficiency symptoms have not been found in healthy people who obtain little vitamin E from their diets [6]. Premature babies of very low birth weight (<1,500 grams) might be deficient in vitamin E. Vitamin E supplementation in these infants might reduce the risk of some complications, such as those affecting the retina, but they can also increase the risk of infections [13].

    DISEASES OF FAT MALABSORTION

    Because the digestive tract requires fat to absorb vitamin E, people with fat-malabsorption disorders are more likely to become deficient than people without such disorders. Deficiency symptoms include peripheral neuropathy, ataxia, skeletal myopathy, retinopathy, and impairment of the immune response [6,14]. People with Crohn’s disease, cystic fibrosis, or an inability to secrete bile from the liver into the digestive tract, for example, often pass greasy stools or have chronic diarrhea; as a result, they sometimes require water-soluble forms of vitamin E, such as tocopheryl polyethylene glycol-1000 succinate [1].

    Some people with abetalipoproteinemia, a rare inherited disorder resulting in poor absorption of dietary fat, require enormous doses of supplemental vitamin E (approximately 100 mg/kg or 5–10 g/day) [1]. Vitamin E deficiency secondary to abetalipoproteinemia causes such problems as poor transmission of nerve impulses, muscle weakness, and retinal degeneration that leads to blindness [15].

    Ataxia and vitamin E deficiency (AVED) is another rare, inherited disorder in which the liver’s alpha-tocopherol transfer protein is defective or absent. People with AVED have such severe vitamin E deficiency that they develop nerve damage and lose the ability to walk unless they take large doses of supplemental vitamin E [16].

    Vitamin E and Health

    Many claims have been made about vitamin E’s potential to promote health and prevent and treat disease. The mechanisms by which vitamin E might provide this protection include its function as an antioxidant and its roles in anti-inflammatory processes, inhibition of platelet aggregation, and immune enhancement.

    A primary barrier to characterizing the roles of vitamin E in health is the lack of validated biomarkers for vitamin E intake and status to help relate intakes to valid predictors of clinical outcomes [6]. This section focuses on four diseases and disorders in which vitamin E might be involved: heart disease, cancer, eye disorders, and cognitive decline.

    Coronary heart disease

    Evidence that vitamin E could help prevent or delay coronary heart disease (CHD) comes from several sources. In vitro studies have found that the nutrient inhibits oxidation of low-density lipoprotein (LDL) cholesterol, thought to be a crucial initiating step for atherosclerosis [6]. Vitamin E might also help prevent the formation of blood clots that could lead to a heart attack or venous thromboembolism [17].

    Several observational studies have associated lower rates of heart disease with higher vitamin E intakes. One study of approximately 90,000 nurses found that the incidence of heart disease was 30% to 40% lower in those with the highest intakes of vitamin E, primarily from supplements [18]. Among a group of 5,133 Finnish men and women followed for a mean of 14 years, higher vitamin E intakes from food were associated with decreased mortality from CHD [19].

    However, randomized clinical trials cast doubt on the efficacy of vitamin E supplements to prevent CHD [20]. For example, the Heart Outcomes Prevention Evaluation (HOPE) study, which followed almost 10,000 patients at high risk of heart attack or stroke for 4.5 years [21], found that participants taking 400 IU/day of natural vitamin E (268 mg) experienced no fewer cardiovascular events or hospitalizations for heart failure or chest pain than participants taking a placebo. In the HOPE-TOO followup study, almost 4,000 of the original participants continued to take vitamin E or placebo for an additional 2.5 years [22]. HOPE-TOO found that vitamin E provided no significant protection against heart attacks, strokes, unstable angina, or deaths from cardiovascular disease or other causes after 7 years of treatment. Participants taking vitamin E, however, were 13% more likely to experience, and 21% more likely to be hospitalized for, heart failure, a statistically significant but unexpected finding not reported in other large studies.

    The HOPE and HOPE-TOO trials provide compelling evidence that moderately high doses of vitamin E supplements do not reduce the risk of serious cardiovascular events among men and women >50 years of age with established heart disease or diabetes [23]. These findings are supported by evidence from the Women’s Angiographic Vitamin and Estrogen study, in which 423 postmenopausal women with some degree of coronary stenosis took supplements with 400 IU vitamin E (form not specified) and 500 mg vitamin C twice a day or placebo for >4 years [24]. Not only did the supplements provide no cardiovascular benefits, but all-cause mortality was significantly higher in the women taking the supplements.

    The latest published clinical trial of vitamin E’s effects on the heart and blood vessels of women included almost 40,000 healthy women ≥45 years of age who were randomly assigned to receive either 600 IU of natural vitamin E (402 mg) on alternate days or placebo and who were followed for an average of 10 years [25]. The investigators found no significant differences in rates of overall cardiovascular events (combined nonfatal heart attacks, strokes, and cardiovascular deaths) or all-cause mortality between the groups. However, the study did find two positive and significant results for women taking vitamin E: they had a 24% reduction in cardiovascular death rates, and those ≥65 years of age had a 26% decrease in nonfatal heart attack and a 49% decrease in cardiovascular death rates.

    The most recent published clinical trial of vitamin E and men’s cardiovascular health included almost 15,000 healthy physicians ≥50 years of age who were randomly assigned to receive 400 IU synthetic alpha-tocopherol (180 mg) every other day, 500 mg vitamin C daily, both vitamins, or placebo [26]. During a mean follow-up period of 8 years, intake of vitamin E (and/or vitamin C) had no effect on the incidence of major cardiovascular events, myocardial infarction, stroke, or cardiovascular morality. Furthermore, use of vitamin E was associated with a significantly increased risk of hemorrhagic stroke.

    In general, clinical trials have not provided evidence that routine use of vitamin E supplements prevents cardiovascular disease or reduces its morbidity and mortality. However, participants in these studies have been largely middle-aged or elderly individuals with demonstrated heart disease or risk factors for heart disease. Some researchers have suggested that understanding the potential utility of vitamin E in preventing CHD might require longer studies in younger participants taking higher doses of the supplement [27]. Further research is needed to determine whether supplemental vitamin E has any protective value for younger, healthier people at no obvious risk of CHD.

    Cancer

    Antioxidant nutrients like vitamin E protect cell constituents from the damaging effects of free radicals that, if unchecked, might contribute to cancer development [9]. Vitamin E might also block the formation of carcinogenic nitrosamines formed in the stomach from nitrites in foods and protect against cancer by enhancing immune function [28]. Unfortunately, human trials and surveys that have attempted to associate vitamin E intake with cancer incidence have found that vitamin E is not beneficial in most cases.

    Both the HOPE-TOO Trial and Women’s Health Study evaluated whether vitamin E supplements might protect people from cancer. HOPE-TOO, which followed men and women ≥55 years of age with heart disease or diabetes for 7 years, found no significant differences in the number of new cancers or cancer deaths between individuals randomly assigned to take 400 IU/day of natural vitamin E (268 mg) or a placebo [22]. In the Women’s Health Study, in which healthy women ≥45 years of age received either 600 IU of natural vitamin E (402 mg) every other day or a placebo for 10 years, the supplement did not reduce the risk of developing any form of cancer [25].

    Several studies have examined whether vitamin E intake and/or supplemental vitamin E affects the risk of developing prostate cancer. A prospective cohort study of >29,000 men found no association between dietary or supplemental vitamin E intake and prostate cancer risk [29]. However, among current smokers and men who had quit, vitamin E intakes of more than 400 IU/day (form not specified) were associated with a statistically significant 71% reduction in the risk of advanced prostate cancer. In a clinical trial involving 29,133 male smokers, men randomly assigned to take daily supplements of 111 IU of synthetic vitamin E (50 mg, as dl-alpha-tocopheryl acetate) for 5–8 years had 32% fewer prostate cancers compared to subjects who did not take the supplements [30]. Based in part on the promising results of this study, a large randomized clinical trial, called the SELECT trial, began in 2001 to determine whether 7–12 years of daily supplementation with 400 IU of synthetic vitamin E (180 mg, as dl-alpha-tocopheryl acetate), with or without selenium (200 mcg, as L-selenomethionine), reduced the number of new prostate cancers in 35,533 healthy men age 50 and older. The trial was discontinued in October 2008 when an analysis found that the supplements, taken alone or together for about 5.5 years, did not prevent prostate cancer [31]. Results from an additional 1.5 years of follow-up from this trial (during which the subjects no longer received vitamin E or selenium), showed that the men who had taken the vitamin E had a 17 percent increased risk of prostate cancer compared to men only taking placebos, a statistically significant difference [32]. The risk of developing prostate cancer was also slightly increased in subjects taking vitamin E plus selenium or selenium alone, but the differences were not statistically significant. No differences were found among groups in the incidence of lung or colorectal cancers or all cancers combined. Study staff members will continue to monitor participants’ health for up to 5 more years. The National Cancer Institute website provides additional information on the SELECT trial.

    One study of women in Iowa provides evidence that higher intakes of vitamin E from foods and supplements could decrease the risk of colon cancer, especially in women <65 years of age [33]. The overall relative risk for the highest quintile of intake (>35.7 IU/day, form not specified) compared to the lowest quintile (<5.7 IU/day, form not specified) was 0.32. However, prospective cohort studies of 87,998 women in the Nurses’ Health Study and 47,344 men in the Health Professionals Follow-up Study failed to replicate these results [34]. Although some research links higher intakes of vitamin E with decreased incidence of breast cancer, an examination of the impact of dietary factors, including vitamin E, on the incidence of postmenopausal breast cancer in >18,000 women found no benefit from the vitamin [35].

    The American Cancer Society conducted an epidemiologic study examining the association between use of vitamin C and vitamin E supplements and bladder cancer mortality. Of the almost one million adults followed between 1982 and 1998, adults who took supplemental vitamin E for 10 years or longer had a reduced risk of death from bladder cancer [36]; vitamin C supplementation provided no protection.

    Evidence to date is insufficient to support taking vitamin E to prevent cancer. In fact, daily use of large-dose vitamin E supplements (400 IU of synthetic vitamin E [180 mg]) may increase the risk of prostate cancer.

    Eye disorders

    Age-related macular degeneration (AMD) and cataracts are among the most common causes of significant vision loss in older people. Their etiologies are usually unknown, but the cumulative effects of oxidative stress have been postulated to play a role. If so, nutrients with antioxidant functions, such as vitamin E, could be used to prevent or treat these conditions.

    Prospective cohort studies have found that people with relatively high dietary intakes of vitamin E (e.g., 20 mg/day [30 IU]) have an approximately 20% lower risk of developing AMD than people with low intakes (e.g., <10 mg/day [<15 IU]) [37,38]. However, two randomized controlled trials in which participants took supplements of vitamin E (500 IU/day [335 mg] d-alpha-tocopherol in one study [39] and 111 IU/day (50 mg) dl-alpha-tocopheryl acetate combined with 20 mg/day beta-carotene in the other [40]) or a placebo failed to show a protective effect for vitamin E on AMD. The Age-Related Eye Disease Study (AREDS), a large randomized clinical trial, found that participants at high risk of developing advanced AMD (i.e., those with intermediate AMD or those with advanced AMD in one eye) reduced their risk of developing advanced AMD by 25% by taking a daily supplement containing vitamin E (400 IU [180 mg] dl-alpha-tocopheryl acetate), beta-carotene (15 mg), vitamin C (500 mg), zinc (80 mg), and copper (2 mg) compared to participants taking a placebo over 5 years [41]. A follow-up AREDS2 study confirmed the value of this and similar supplement formulations in reducing the progression of AMD over a median follow-up period of 5 years” [42].

    Several observational studies have revealed a potential relationship between vitamin E supplements and the risk of cataract formation. One prospective cohort study found that lens clarity was superior in participants who took vitamin E supplements and those with higher blood levels of the vitamin [43]. In another study, long-term use of vitamin E supplements was associated with slower progression of age-related lens opacification [44]. However, in the AREDS trial, the use of a vitamin E-containing (as dl-alpha-tocopheryl acetate) formulation had no apparent effect on the development or progression of cataracts over an average of 6.3 years [45]. The AREDS2 study, which also tested formulations containing 400 IU (180 mg) vitamin E, confirmed these findings” [46].

    Overall, the available evidence is inconsistent with respect to whether vitamin E supplements, taken alone or in combination with other antioxidants, can reduce the risk of developing AMD or cataracts. However, the formulations of vitamin E, other antioxidants, zinc, and copper used in AREDS hold promise for slowing the progression of AMD in people at high risk of developing advanced AMD.

    No Evidence of Prevention Cognitive decline

    The brain has a high oxygen consumption rate and abundant polyunsaturated fatty acids in the neuronal cell membranes. Researchers hypothesize that if cumulative free-radical damage to neurons over time contributes to cognitive decline and neurodegenerative diseases, such as Alzheimer’s disease, then ingestion of sufficient or supplemental antioxidants (such as vitamin E) might provide some protection [47]. This hypothesis was supported by the results of a clinical trial in 341 patients with Alzheimer’s disease of moderate severity who were randomly assigned to receive a placebo, vitamin E (2,000 IU/day dl-alpha-tocopherol), a monoamine oxidase inhibitor (selegiline), or vitamin E and selegiline [47]. Over 2 years, treatment with vitamin E and selegiline, separately or together, significantly delayed functional deterioration and the need for institutionalization compared to placebo. However, participants taking vitamin E experienced significantly more falls.

    Vitamin E consumption from foods or supplements was associated with less cognitive decline over 3 years in a prospective cohort study of elderly, free-living individuals aged 65–102 years [48]. However, a clinical trial in primarily healthy older women who were randomly assigned to receive 600 IU (402 mg) d-alpha-tocopherol every other day or a placebo for ≤4 years found that the supplements provided no apparent cognitive benefits [49]. Another trial in which 769 men and women with mild cognitive impairment were randomly assigned to receive 2,000 IU/day vitamin E (form not specified), a cholinesterase inhibitor (donepezil), or placebo found no significant differences in the progression rate of Alzheimer’s disease between the vitamin E and placebo groups [50]

    In summary, most research results do not support the use of vitamin E supplements by healthy or mildly impaired individuals to maintain cognitive performance or slow its decline with normal aging [51]. More research is needed to identify the role of vitamin E, if any, in the management of cognitive impairment [52].

    Health Risks from Excessive Vitamin E

    Research has not found any adverse effects from consuming vitamin E in food [6]. However, high doses of alpha-tocopherol supplements can cause hemorrhage and interrupt blood coagulation in animals, and in vitro data suggest that high doses inhibit platelet aggregation. Two clinical trials have found an increased risk of hemorrhagic stroke in participants taking alpha-tocopherol; one trial included Finnish male smokers who consumed 50 mg/day for an average of 6 years [53] and the other trial involved a large group of male physicians in the United States who consumed 400 IU (180 mg) of synthetic vitamin E every other day for 8 years [26]. Because the majority of physicians in the latter study were also taking aspirin, this finding could indicate that vitamin E has a tendency to cause bleeding.

    The FNB has established ULs for vitamin E based on the potential for hemorrhagic effects (see Table 3). The ULs apply to all forms of supplemental alpha-tocopherol, including the eight stereoisomers present in synthetic vitamin E. Doses of up to 1,000 mg/day (1,500 IU/day of the natural form or 1,100 IU/day of the synthetic form) in adults appear to be safe, although the data are limited and based on small groups of people taking up to 3,200 mg/day of alpha-tocopherol for only a few weeks or months. Long-term intakes above the UL increase the risk of adverse health effects [6]. Vitamin E ULs for infants have not been established.

    AgeMaleFemalePregnancyLactation
    1–3 years200 mg200 mg
    4–8 years300 mg300 mg
    9–13 years600 mg600 mg
    14–18 years800 mg800 mg800 mg800 mg
    19+ years1,000 mg1,000 mg1,000 mg1,000 mg


    Two meta-analyses of randomized trials have also raised questions about the safety of large doses of vitamin E, including doses lower than the UL. These meta-analyses linked supplementation to small but statistically significant increases in all-cause mortality. One analysis found an increased risk of death at doses of 400 IU/day (form not specified), although the risk began to increase at 150 IU [54]. In the other analysis of studies of antioxidant supplements for disease prevention, the highest quality trials revealed that vitamin E, administered singly (dose range 10 IU–5,000 IU/day; mean 569 IU [form not specified]) or combined with up to four other antioxidants, significantly increased mortality risk [55].

    The implications of these analyses for the potential adverse effects of high-dose vitamin E supplements are unclear [56-59]. Participants in the studies included in these analyses were typically middle-aged or older and had chronic diseases or related risk factors. These participants often consumed other supplements in addition to vitamin E. Some of the studies analyzed took place in developing countries in which nutritional deficiencies are common. A review of the subset of studies in which vitamin E supplements were given to healthy individuals for the primary prevention of chronic disease found no convincing evidence that the supplements increased mortality [60].

    However, results from the recently published, large SELECT trial show that vitamin E supplements (400 IU/day [180 mg] as dl-alpha-tocopheryl acetate) may harm adult men in the general population by increasing their risk of prostate cancer [32]. Follow-up studies are assessing whether the cancer risk was associated with baseline blood levels of vitamin E and selenium prior to supplementation as well as whether changes in one or more genes might increase a man’s risk of developing prostate cancer while taking vitamin E.

    Interactions with Medications

    Vitamin E supplements have the potential to interact with several types of medications. A few examples are provided below. People taking these and other medications on a regular basis should discuss their vitamin E intakes with their health care providers.

    Anticoagulant and antiplatelet medications

    Vitamin E can inhibit platelet aggregation and antagonize vitamin K-dependent clotting factors. As a result, taking large doses with anticoagulant or antiplatelet medications, such as warfarin (Coumadin®), can increase the risk of bleeding, especially in conjunction with low vitamin K intake. The amounts of supplemental vitamin E needed to produce clinically significant effects are unknown but probably exceed 400 IU/day [61].

    Simvastatin and niacin

    Some people take vitamin E supplements with other antioxidants, such as vitamin C, selenium, and beta-carotene. This collection of antioxidant ingredients blunted the rise in high-density lipoprotein (HDL) cholesterol levels, especially levels of HDL2, the most cardioprotective HDL component, among people treated with a combination of simvastatin (brand name Zocor®) and niacin [62,63].

    Chemotherapy and radiotherapy

    Oncologists generally advise against the use of antioxidant supplements during cancer chemotherapy or radiotherapy because they might reduce the effectiveness of these therapies by inhibiting cellular oxidative damage in cancerous cells [64,65]. Although a systematic review of randomized controlled trials has called this concern into question [66], further research is needed to evaluate the potential risks and benefits of concurrent antioxidant supplementation with conventional therapies for cancer.

    Vitamin E and Healthful Diets

    The federal government’s 2020-2025 Dietary Guidelines for Americans notes that “Because foods provide an array of nutrients and other components that have benefits for health, nutritional needs should be met primarily through foods. … In some cases, fortified foods and dietary supplements are useful when it is not possible otherwise to meet needs for one or more nutrients (e.g., during specific life stages such as pregnancy).”

    For more information about building a healthy dietary pattern, refer to the Dietary Guidelines for Americans and the U.S. Department of Agriculture’s MyPlate.

    The Dietary Guidelines for Americans describes a healthy dietary pattern as one that:

    • Includes a variety of vegetables; fruits; grains (at least half whole grains); fat-free and low-fat milk, yogurt, and cheese; and oils.Vitamin E is found in green leafy vegetables, whole grains, fortified cereals, and vegetable oils.
    • Includes a variety of protein foods such as lean meats; poultry; eggs; seafood; beans, peas, and lentils; nuts and seeds; and soy products.Nuts are good sources of vitamin E.
    • Limits foods and beverages higher in added sugars, saturated fat, and sodium.
    • Limits alcoholic beverages.
    • Stays within your daily calorie needs.

    References

    1. Traber MG. Vitamin E. In: Shils ME, Shike M, Ross AC, Caballero B, Cousins R, eds. Modern Nutrition in Health and Disease. 10th ed. Baltimore, MD: Lippincott Williams & Wilkins, 2006;396-411.
    2. Traber MG. Vitamin E regulatory mechanisms. Annu Rev Nutr 2007;27:347-62. [PubMed abstract]
    3. Sen CK, Khanna S, Roy S. Tocotrienols: vitamin E beyond tocopherols. Life Sci 2006;78:2088-98. [PubMed abstract]
    4. Dietrich M, Traber MG, Jacques PF, Cross CE, Hu Y, Block G. Does γ-tocopherol play a role in the primary prevention of heart disease and cancer? A review. Am J Coll Nutr 2006;25:292-9. [PubMed abstract]
    5. Verhagen H, Buijsse B, Jansen E, Bueno-de-Mesquita B. The state of antioxidant affairs. Nutr Today 2006;41:244-50.
    6. Institute of Medicine. Food and Nutrition Board. Dietary Reference Intakes: Vitamin C, Vitamin E, Selenium, and Carotenoids. Washington, DC: National Academy Press, 2000.
    7. U.S. Food and Drug Administration. Food Labeling: Revision of the Nutrition and Supplement Facts Labels. 2016.
    8. U.S. Food and Drug Administration. Food Labeling: Revision of the Nutrition and Supplement Facts Labels and Serving Sizes of Foods That Can Reasonably Be Consumed at One Eating Occasion; Dual-Column Labeling; Updating, Modifying, and Establishing Certain Reference Amounts Customarily Consumed; Serving Size for Breath Mints; and Technical Amendments; Proposed Extension of Compliance Dates. 2017.
    9. U.S. Department of Agriculture, Agricultural Research Service. FoodData Central, 2019.
    10. Gao X, Wilde PE, Lichtenstein AH, Bermudez OI, Tucker KL. The maximal amount of dietary á-tocopherol intake in U.S. adults (NHANES 2001-2002). J Nutr 2006;136:1021-6. [PubMed abstract]
    11. Interagency Board for Nutrition Monitoring and Related Research. Third Report on Nutrition Monitoring in the United States. Washington, DC: U.S. Government Printing Office, 1995.
    12. Ford ES, Ajani UA, Mokdad AH. Brief communication: the prevalence of high intake of vitamin E from the use of supplements among U.S. adults. Ann Intern Med 2005;143:116-20. [PubMed abstract]
    13. Brion LP, Bell EF, Raghuveer TS. Vitamin E supplementation for prevention of morbidity and mortality in preterm infants. Cochrane Database Syst Rev;4:CD003665. [PubMed abstract]
    14. Kowdley KV, Mason JB, Meydani SN, Cornwall S, Grand RJ. Vitamin E deficiency and impaired cellular immunity related to intestinal fat malabsorption. Gastroenterology 1992;102:2139-42. [PubMed abstract]
    15. Tanyel MC, Mancano LD. Neurologic findings in vitamin E deficiency. Am Fam Physician 1997;55:197-201. [PubMed abstract]
    16. Cavalier L, Ouahchi K, Kayden H, Donato S, Reutenaucer L, Mandel JL, et al. Ataxia with isolated vitamin E deficiency: heterogeneity of mutations and phenotypic variability in a large number of families. Am J Hum Genet 1998;62:301-10. [PubMed abstract]
    17. Glynn RJ, Ridker PM, Goldhaber SZ, Zee RY, Buring JE. Effects of random allocation to vitamin E supplementation on the occurrence of venous thromboembolism: report from the Women’s Health Study. Circulation 2007;116:1497-1503. [PubMed abstract]
    18. Stampfer MJ, Hennekens CH, Manson JE, Colditz GA, Rosner B, Willett WC. Vitamin E consumption and the risk of coronary disease in women. N Engl J Med 1993;328:1444-9. [PubMed abstract]
    19. Knekt P, Reunanen A, Jarvinen R, Seppanen R, Heliovaara M, Aromaa A. Antioxidant vitamin intake and coronary mortality in a longitudinal population study. Am J Epidemiol 1994;139:1180-9. [PubMed abstract]
    20. Traber MG. Heart disease and single-vitamin supplementation. Am J Clin Nutr 2007;85:293S-9S. [PubMed abstract]
    21. Jialal I, Devaraj S. Vitamin E supplementation and cardiovascular events in high-risk patients. N Engl J Med 2000;342:154-60. [PubMed abstract]
    22. Lonn E, Bosch J, Yusuf S, Sheridan P, Pogue J, Arnold JM, et al.; HOPE and HOPE-TOO Trial Investigators. Effects of long-term vitamin E supplementation on cardiovascular events and cancer: a randomized controlled trial. JAMA 2005;293:1338-47. [PubMed abstract]
    23. Brown BG, Crowley J. Is there any hope for vitamin E? JAMA 2005;293:1387-90. [PubMed abstract]
    24. Waters DD, Alderman EL, Hsia J, Howard BV, Cobb FR, Rogers WJ, et al. Effects of hormone replacement therapy and antioxidant vitamin supplements on coronary atherosclerosis in postmenopausal women: a randomized controlled trial. J Am Med Assoc 2002;288:2432-40. [PubMed abstract]
    25. Lee I-M, Cook NR, Gaziano JM, Gordon D, Ridker PM, Manson JE, et al. Vitamin E in the primary prevention of cardiovascular disease and cancer: the Women’s Health Study: a randomized controlled trial. JAMA 2005;294:56-65. [PubMed abstract]
    26. Sesso HD, Buring JE, Christen WG, Kurth T, Belanger C, MacFadyen J, et al. Vitamins E and C in the prevention of cardiovascular disease in men: the Physicians’ Health Study II randomized controlled trial. JAMA 2008;300:2123-33. [PubMed abstract]
    27. Blumberg JB, Frei B. Why clinical trials of vitamin E and cardiovascular diseases may be fatally flawed. Commentary on “The relationship between dose of vitamin E and suppression of oxidative stress in humans.” Free Radic Biol Med 2007;43:1374-6. [PubMed abstract]
    28. Weitberg AB, Corvese D. Effect of vitamin E and beta-carotene on DNA strand breakage induced by tobacco-specific nitrosamines and stimulated human phagocytes. J Exp Clin Cancer Res 1997;16:11-4. [PubMed abstract]
    29. Kirsh VA, Hayes RB, Mayne ST, Chatterjee N, Subar AF, Dixon LB, et al. Supplemental and dietary vitamin E, β-carotene, and vitamin C intakes and prostate cancer risk. J Natl Cancer Inst 2006;98:245-54. [PubMed abstract]
    30. Heinonen OP, Albanes D, Virtamo J, Taylor PR, Huttunen JK, Hartman AM, Haapakoski J, Malila N, Rautalahti M, Ripatti S, Mäenpää H, Teerenhovi L, Koss L, Virolainen M, Edwards BK. Prostate cancer and supplementation with alpha-tocopherol and beta-carotene: incidence and mortality in a controlled trial. J Natl Cancer Inst. 1998 Mar 18;90(6):440-6. [PubMed abstract]
    31. National Cancer Institute. Questions and Answers: Selenium and Vitamin E Cancer Prevention Trial (SELECT).
    32. Klein EA, Thompson Jr. IM, Tangen CM, Crowley JJ, Lucia MS, Goodman PJ, et al. Vitamin E and the risk of prostate cancer: the Selenium and Vitamin E Cancer Prevention Trial (SELECT). JAMA 2011;306:1549-1556. [PubMed abstract]
    33. Bostick RM, Potter JD, McKenzie DR, Sellers TA, Kushi LH, Steinmetz KA, et al. Reduced risk of colon cancer with high intakes of vitamin E: the Iowa Women’s Health Study. Cancer Res 1993;15:4230-17. [PubMed abstract]
    34. Wu K, Willett WC, Chan JM, Fuchs CS, Colditz GA, Rimm EB, et al. A prospective study on supplemental vitamin E intake and risk of colon cancer in women and men. Cancer Epidemiol Biomarkers Prev 2002;11:1298-304. [PubMed abstract]
    35. Graham S, Sielezny M, Marshall J, Priore R, Freudenheim J, Brasure J, et al. Diet in the epidemiology of postmenopausal breast cancer in the New York State Cohort. Am J Epidemiol 1992;136:3127-37. [PubMed abstract]
    36. Jacobs EJ, Henion AK, Briggs PJ, Connell CJ, McCullough ML, Jonas CR, et al. Vitamin C and vitamin E supplement use and bladder cancer mortality in a large cohort of US men and women. Am J Epidemiol 2002;156:1002-10. [PubMed abstract]
    37. Chong EW-T, Wong TY, Kreis AJ, Simpson JA, Guymer RH. Dietary antioxidants and primary prevention of age-related macular degeneration: systematic review and meta-analysis. BMJ 2007;335:755. [PubMed abstract]
    38. Evans J. Primary prevention of age related macular degeneration. BMJ 2007;335:729. [PubMed abstract]
    39. Taylor HR, Tikellis G, Robman LD, McCarty CA, McNeil JJ. Vitamin E supplementation and macular degeneration: randomized controlled trial. BMJ 2002;325:11. [PubMed abstract]
    40. Teikari JM, Virtamo J, Rautalahti M, Palmgren J, Liesto K, Heinonen OP. Long-term supplementation with alpha-tocopherol and beta-carotene and age-related cataract. Acta Ophthalmol Scand 1997;75:634-40. [PubMed abstract]
    41. Age-Related Eye Disease Study Research Group. A randomized, placebo-controlled, clinical trial of high-dose supplementation with vitamins C and E, beta carotene, and zinc for age-related macular degeneration and vision loss: AREDS report no. 8. Arch Ophthalmol 2001;119:1417-36. [PubMed abstract]
    42. The Age-Related Eye Disease Study 2 (AREDS2) Research Group. Lutein + zeaxanthin and omega-3 fatty acids for age-related macular degeneration: the Age-Related Eye Disease Study 2 (AREDS2) randomized clinical trial. JAMA 2013;309:2005-15. [PubMed abstract]
    43. Leske MC, Chylack LT Jr, He Q, Wu SY, Schoenfeld E, Friend J, et al. Antioxidant vitamins and nuclear opacities: the longitudinal study of cataract. Ophthalmology 1998;105:831-6. [PubMed abstract]
    44. Jacques PF, Taylor A, Moeller S, Hankinson SE, Rogers G, Tung W, et al. Long-term nutrient intake and 5-year change in nuclear lens opacities. Arch Ophthalmol 2005;123:517-26. [PubMed abstract]
    45. Age-Related Eye Disease Study Research Group. A randomized, placebo-controlled, clinical trial of high-dose supplementation with vitamins C and E and beta carotene for age-related cataract and vision loss: AREDS report no. 9. Arch Opthalmol 2001;119:1439-52. [PubMed abstract]
    46. The Age-Related Eye Disease Study 2 (AREDS2) Research Group. Lutein/zeaxanthin for the treatment of age-related cataract: AREDS2 randomized trial report no. 4. JAMA Ophthalmol 2013. Online May 5. [PubMed abstract]
    47. Sano M, Ernesto C, Thomas RG, Klauber MR, Schafer K, Grundman M, et al. A controlled trial of selegiline, alpha-tocopherol, or both as treatment for Alzehimer’s disease. N Engl J Med 1997;336:1216-22. [PubMed abstract]
    48. Morris MC, Evand DA, Bienias JL, Tangney CC, Wilson RS. Vitamin E and cognitive decline in older persons. Arch Neurol 2002;59:1125-32. [PubMed abstract]
    49. Kang JH, Cook N, Manson J, Buring J, Grodstein F. A randomized trial of vitamin E supplementation and cognitive function in women. Arch Intern Med 2006;166:2462-8. [PubMed abstract]
    50. Petersen RC, Thomas RG, Grundman M, Bennett D, Doody R, Ferris S, et al. Vitamin E and donepezil for the treatment of mild cognitive impairment. N Engl J Med 2005;352:2379-88. [PubMed abstract]
    51. Espeland MA. Preventing cognitive decline in usual aging. Arch Intern Med 2006;166:2433-4. [PubMed abstract]
    52. Isaac MGEKN, Quinn R, Tabet N. Vitamin E for Alzheimer’s disease and mild cognitive impairment (review). Cochrane Database Syst Rev 2008;(3):CD002854. [PubMed abstract]
    53. Alpha-Tocopherol, Beta Carotene Cancer Prevention Study Group. The effect of vitamin E and beta carotene on the incidence of lung cancer and other cancers in male smokers. N Engl J Med 1994;330:1029-35. [PubMed abstract]
    54. Miller ER 3rd, Pastor-Barriuso R, Dalal D, Riemersma RA, Appel LJ, Guallar E. Meta-analysis: high-dosage vitamin E supplementation may increase all-cause mortality. Ann Intern Med 2005;142:37-46. [PubMed abstract]
    55. Bjelakovic G, Nikolova D, Gluud LL, Simonetti RG, Gluud C. Mortality in randomized trials of antioxidant supplements for primary and secondary prevention: systematic review and meta-analysis. JAMA 2007;297:842-57. [PubMed abstract]
    56. Comments and responses: high dosage vitamin E supplementation and all-cause mortality. Ann Intern Med 2005;143:150-7.
    57. Greenberg ER. Vitamin E supplements: good in theory, but is the theory good? Ann Intern Med 2005;142:75-6. [PubMed abstract]
    58. Hathcock JN, Azzi A, Blumberg J, Bray T, Dickinson A, Frei B, et al. Vitamins E and C are safe across a broad range of intakes. Am J Clin Nutr 2005;81:367-45. [PubMed abstract]
    59. Various authors. Letters: antioxidant supplements and mortality. JAMA 2007;298:400-3.
    60. Huang HY, Caballero B, Chang S, Alberg A, Semba R, Schneyer C, et al. Multivitamin/Mineral Supplements and Prevention of Chronic Disease. Evidence Report/Technology Assessment No. 139. (Prepared by The Johns Hopkins University Evidence-based Practice Center under Contract No. 290-02-0018). AHRQ Publication No. 06-E012. Rockville, MD: Agency for Healthcare Research and Quality. May 2008.
    61. Natural Medicines Comprehensive Database. Vitamin E.
    62. Brown BG, Zhao X-Q, Chait A, Fisher LD, Cheung MC, Morse JS, et al. Simvastatin and niacin, antioxidant vitamins, or the combination for the prevention of coronary disease. N Engl J Med 2001;345:1583-92. [PubMed abstract]
    63. Cheung MC, Zhao X-Q, Chait A, Albers JJ, Brown BG. Antioxidant supplements block the response of HDL to simvastatin-niacin therapy in patients with coronary artery disease and low HDL. Arterioscler Thromb Vasc Biol 2001;21:1320-6. [PubMed abstract]
    64. Doyle C, Kushi LH, Byers T, Courneya KS, Demark-Wahnefried W, Grant B, et al., for the 2006 Nutrition, Physical Activity and Cancer Survivorship Advisory Committee. Nutrition and physical activity during and after cancer treatment: an American Cancer Society guide for informed choices. CA Cancer J Clin 2006;56:323-53. [PubMed abstract]
    65. Lawenda BD, Kelly KM, Ladas EJ, Sagar SM, Vickers A, Blumberg JB. Should supplemental antioxidant administration be avoided during chemotherapy and radiation therapy? J Natl Cancer Inst 2008;100:773-83. [PubMed abstract]
    66. Block KI, Koch AC, Mead MN, Tothy PK, Newman RA, Gyllenhaal C. Impact of antioxidant supplementation on chemotherapeutic efficacy: a systematic review of the evidence from randomized controlled trials. Cancer Treat Rev 2007;33:407-18. [PubMed abstract]

    Disclaimer

    This fact sheet by the National Institutes of Health (NIH) Office of Dietary Supplements (ODS) provides information that should not take the place of medical advice. We encourage you to talk to your health care providers (doctor, registered dietitian, pharmacist, etc.) about your interest in, questions about, or use of dietary supplements and what may be best for your overall health. Any mention in this publication of a specific product or service, or recommendation from an organization or professional society, does not represent an endorsement by ODS of that product, service, or expert advice.

    Updated: March 26, 2021 History of changes to this fact sheet

    • Share: 
    • 
    • 
    • 
    • Find ODS on: 
    NIH Office of Dietary Supplements

    Download free Acrobat Reader 

    Health Information

  • THE SKINNY ON FATS

    foods with fat

    What you eat can affect your LDL (bad) cholesterol. Knowing which fats raise LDL cholesterol and which ones don’t can help you lower your risk of heart disease and stroke.

    Your body naturally produces all the LDL cholesterol you need. Eating foods containing saturated and trans fats causes your body to produce even more LDL — raising the level of “bad” cholesterol in your blood.

    It’s worth understanding the different kinds of fats: Saturated, trans and unsaturated.

    Saturated fat

    Saturated fats are fat molecules that are “saturated” with hydrogen molecules. They are typically solids at room temperature.

    Saturated fats occur naturally in many foods — primarily meat and dairy products. Beef, lamb, pork on poultry (with the skin on) contain saturated fats, as do butter, cream and cheese made from whole or 2% milk. Plant-based foods that contain saturated fats include coconut, coconut oil and cocoa butter, as well as palm oil and palm kernel oil (often called tropical oils).

    For people who need to lower their cholesterol, the American Heart Association recommends reducing saturated fat to less than 6% of total daily calories. For someone eating 2,000 calories a day, that’s about 11 to 13 grams of saturated fat.

    Trans Fat

    Trans fats (or trans fatty acids) are created in an industrial process that adds hydrogen to liquid vegetable oils to make them more solid. Another name for trans fats is “partially hydrogenated oils.”

    Trans fats raise your bad (LDL) cholesterol levels and lower your good (HDL) cholesterol levels. These changes are associated with a higher risk of heart disease.

    Trans fats are found in many fried foods. Baked goods, such as pastries, pizza dough, pie crust, cookies and crackers also can contain trans fats.

    Since 2006, the FDA has required trans fat content to be listed on the Nutrition Facts panel of packaged foods. In recent years, many major national fast-food chains and casual-dining restaurant chains have announced they will no longer use trans fats to fry or deep-fry foods.

    The American Heart Association recommends that adults who would benefit from lowering LDL cholesterol eliminate trans fat from their diet.

    To find the amount of trans fats in a particular packaged food, look at the Nutrition Facts panel. Companies must list any measurable amount of trans fat (0.5 grams or more per serving) in a separate line in the “Total Fat” section of the panel, directly beneath the line for “Saturated Fat.” This means if a food package states 0 grams of trans fats, it might still have some trans fats if the amount per serving is less than 0.5 g. Make sure to check the ingredients list for “partially hydrogenated oil.”

    Unsaturated fat

    The two kinds of unsaturated fats are: monounsaturated and polyunsaturated. Monounsaturated fats have one (“mono”) unsaturated carbon bond in the molecule. Polyunsaturated fats have more than one (“poly,” for many) unsaturated carbon bonds. Both of these unsaturated fats are typically liquid at room temperature.

    Eaten in moderation, both kinds of unsaturated fats may help improve your blood cholesterol when used in place of saturated and trans fats.

    Unsaturated fats are in fish, such as salmon, trout and herring, and plant-based foods such as avocados, olives and walnuts. Liquid vegetable oils, such as soybean, corn, safflower, canola, olive and sunflower, also contain unsaturated fats.

    Limiting saturated and trans fats

    Here are some ways to lower your intake of saturated and trans fats:

    • Maintain a diet that emphasizes fruits, vegetables, whole grains, low-fat dairy products, poultry, fish and nuts. Also limit red meat and sugar-sweetened foods and beverages.
    • Opt for naturally occurring unhydrogenated vegetable oils such as canola, safflower, sunflower or olive oil.
    • Look for processed foods made with unhydrogenated oil rather than saturated fat or hydrogenated (or partially hydrogenated) vegetable oils.
    • Use soft margarine as a substitute for butter and choose soft margarines (liquid or tub varieties) over harder stick forms. Look for “0 g trans fat” on the Nutrition Facts label.
    • Doughnuts, cookies, crackers, muffins, pies and cakes are examples of foods high in trans fat. Don’t eat them often.
    • Limit commercially fried foods and baked goods made with shortening or partially hydrogenated vegetable oils. These foods are very high in fat, and it’s likely to be trans fat.
    • Limit fried fast food. Commercial shortening and deep-frying fats are still made by hydrogenation and contain saturated and trans fats.

    Consider using a food diary to keep track of what you eat. It’s a handy way to evaluate the healthy, not-so-healthy and unhealthy foods you’re making a part of your everyday diet.

    Learn more about dietary fats and cooking to lower cholesterol.


    Written by American Heart Association editorial staff and reviewed by science and medicine advisers. See our editorial policies and staff.

  • MONOUNSATURATED FAT

    based on a AMERICAN HEART ASSOCIATION publication

    monounsaturated fats

    Monounsaturated fats can have a beneficial effect on your heart when eaten in moderation and when used to replace saturated fat and trans fat in your diet.

    For good health, the majority of the fats that you eat should be monounsaturated or polyunsaturated. Eat foods containing monounsaturated fats and/or polyunsaturated fats instead of foods that contain saturated fats and/or trans fats.

    What are monounsaturated fats?

    From a chemical standpoint, monounsaturated fats are simply fat molecules that have one unsaturated carbon bond in the molecule, this is also called a double bond. Oils that contain monounsaturated fats are typically liquid at room temperature but start to turn solid when chilled. Olive oil is an example of a type of oil that contains monounsaturated fats.

    How do monounsaturated fats affect my health?

    Monounsaturated fats can help reduce bad cholesterol levels in your blood which can lower your risk of heart disease and stroke. They also provide nutrients to help develop and maintain your body’s cells. Oils rich in monounsaturated fats also contribute vitamin E to the diet, an antioxidant vitamin most Americans need more of.

    Are monounsaturated fats better for me than saturated fats or trans fats?

    Yes. While, all fats provide 9 calories per gram, monounsaturated fats and polyunsaturated fats can have a positive effect on your health, when eaten in moderation. The bad fats –saturated fats and trans fats – can negatively affect your health.

    Which foods contain monounsaturated fats?

    Most foods contain a combination of different fats.

    Examples of foods high in monounsaturated fats include plant-based liquid oils such as:

    • olive oil,
    • canola oil,
    • peanut oil,
    • safflower oil and
    • sesame oil. 

    Other sources include avocados, peanut butter, and many nuts and seeds.

    Are monounsaturated fats lower in calories?

    Monounsaturated fats – like all fats – contain nine calories per gram.

  • CORONARY ARTERY IN YOUNG ADULTS AND NUTS


    Association of nut consumption with CVD risk factors in young to middle-aged adults: The Coronary Artery Risk Development in Young Adults (CARDIA) study

    So-Yun Yi 1Lyn M Steffen 2Xia Zhou 1James M Shikany 3David R Jacobs Jr 1

    Affiliations expand

    Abstract

    Background and aims: Few studies have examined long-term associations of walnut, other nut, and no nut consumption with cardiovascular disease (CVD) risk factors. Results from prospective studies with long-term follow-up can provide further evidence for dietary guideline messaging to consume nuts. Therefore, we examined the associations of walnut, other nut, and no nut consumption with diet quality and CVD risk factors over 30 years of follow-up.

    Methods and results: Data were analyzed from 3092 young adults enrolled in the Coronary Artery Risk Development in Young Adults (CARDIA) study. Dietary intake, including walnuts and other nuts, was assessed 3 times over 20 years. CVD risk factors were measured at multiple exams. General linear regression evaluated the associations of walnut, other nut, and no nut consumption with CVD risk factors over 30 years (Y30) of follow-up. The 20-year cumulative mean intake of walnuts (0.74 oz/d), other nuts (1.6 oz/d), or no nut consumption was differentially associated with HEI-2015 and CVD risk factors by Y30. Generally, walnut consumers had significantly higher HEI-2015, lower body mass index, waist circumference, blood pressure, and triglyceride concentration, and gained less weight since baseline than other nut consumers (p ≤ 0.05 for all). Further, walnut consumers had lower fasting blood glucose than no nut consumers (p ≤ 0.05).

    Conclusion: Study findings that walnut and other nut consumption was associated with better CVD risk factors and diet quality aligns with the 2020-2025 US. Dietary Guidelines for Americans recommendation to consume nuts, such as walnuts, within the context of a healthy diet.

    Keywords: CVD risk Factors; Healthy diet; Nuts; Obesity; Observational study; Walnuts.

    Copyright © 2022 The Authors. Published by Elsevier B.V. All rights reserved.

  • HEART RISK AND KETO-DIETS

    Potential cardiovascular risk’ for some on keto-style diet

     ADD TOPIC TO EMAIL ALERTS

    NEW ORLEANS — Certain traditional risk factors including severe high cholesterol, diabetes, hypertension and smoking may increase CV risk among those following a low-carbohydrate, high-fat “keto-style diet,” a speaker reported here.

    In a population-based cohort study, regular consumption of a low-carbohydrate, high-fat diet was associated with elevated LDL cholesterol and apolipoprotein B levels, and an increased risk for incident major adverse coronary events (MACE), Iulia Iatan, MD, PhD, FRCPC, postdoctoral fellow in cardiovascular disease prevention, clinical lipidology and cardiometabolic health at the Centre for Heart Lung Innovation at the University of British Columbia, Vancouver, said during a presentation at the American College of Cardiology Scientific Session.

    Photo by Chevanon Photography on Pexels.com

    “Low-carbohydrate, high-fat diets, like ketogenic diets, have become increasingly popular due to the purported health benefits for a variety of conditions, including epilepsy, obesity and glycemic control for diabetes. This can be seen by the number of increasing publications in the last 10 years and monthly Google searches reaching up to 3.3 million results for ‘ketogenic diet.’ In fact, in 2021, approximately 16% of Americans and 14% of Canadians followed a low-carbohydrate dietary pattern in the previous year. These diets are generally characterized by restrictions of carbohydrates and a relative increase in the proportion of fat,” Iatan said.

    However, Iatan said, “despite the patients who report subjective improvements in their wellbeing during these diets, a known risk of the diets is that they may trigger or exacerbate hypercholesterolemia.”

    Impact on lipids, CV events

    There remains limited data on the effect of low-carbohydrate, high-fat diet — or, keto-style diet — on overall lipid profile and risk for atherosclerotic CVD, Iatan said.

    The researchers conducted a prospective, population-based cohort study, using the U.K. Biobank database to identify adults aged 40 to 69 years recruited from 2006 to 2010 who completed 24-hour dietary surveys.

    The keto-style diet was defined as restricting daily intake of carbohydrates to less than 100 g and/or less than 25% of total daily energy intake and fat more than 45% total daily energy intake. A standard diet was defined as daily dietary parameters not meeting the criteria for the keto-style diet.

    Iatan reported results from 305 participants who followed a keto-style diet and 1,220 who followed a standard diet who were not on lipid-lowering therapy. The mean age was 54 years, 73% were women and the majority were white.

    At baseline, those following a keto-style diet were more likely to have diabetes, elevated BMI and obesity, according to the results. Based on self-reports, individuals who followed a keto-style diet consumed fewer total kcal per day and fewer carbohydrates, free sugars and plant proteins intake, but elevated intake of animal proteins and animal, plant and saturated fats, compared with those who followed a standard diet.

    The primary endpoint was the impact of a keto-style diet on serum lipid levels. Those following a keto-style diet had significantly elevated levels of some lipids and ketone bodies, including:

    • LDL cholesterol (3.8 vs. 3.64 mmol/L; P = .004);
    • ApoB (1.09 vs. 1.04 g/L; < .001);
    • total cholesterol (6.08 vs. 5.85 mmol/L; P = .002);
    • 3-hydroxybutyrate (0.14 vs. 0.06 mmol/L; < .001);
    • acetone (0.02 vs. 0.01 mmol/L; < .001); and
    • acetoacetate (0.02 vs. 0.01 mmol/L; < .001).

    The researchers reported lower levels of lipoprotein(a) (39.43 vs. 46.13 nmol/L; P = .041) and triglycerides (1.34 vs. 1.53 mmol/L; P = .001) with a keto-style diet.

    The overall prevalence of severe hypercholesterolemia (> 5 mmol/L) was higher among individuals who followed a keto-style diet (11.1% vs. 6.2%; P < 001), Iatan told Healio.

    The impact of a keto-style diet on incident MACE, including angina, MI, CAD, ischemic stroke, peripheral arterial disease, and coronary and carotid revascularization, was the study’s secondary endpoint. The proportion of the cohort that experienced an ASCVD event was higher among those who followed a keto-style (4.3% vs. 9.8%). Following adjustment for diabetes, hypertension, smoking and BMI, the risk for incident ASCVD events was more than twofold among patients following a keto-style diet compared with a standard diet (HR = 2.18; 95% CI, 1.39-3.43; P for all < .001), Iatan told Healio. 

    In a subgroup analysis, patients who followed a keto-style diet and had an LDL level of 5 mmol/L or more had a nearly sevenfold greater risk for ASCVD compared with those who followed a standard diet and had an LDL level less than 3.5 mmol/L (HR = 6.68; 95% CI, 2.62-17.09; P < .001), according to the results.

    Hypercholesterolemia ‘should not be presumed to be benign’

    Based on our results for the primary and secondary endpoints, we show that in this population-based cohort of British descent, habitual consumption of a self-reported low-carb, high-fat diet was associated with increased LDL cholesterol and ApoB levels and increased risk of incident MACE,” Iatan concluded.

    “These findings highlight the potential CV risk of this dietary pattern and suggest that hypercholesterolemia during this low-carb high-fat diet should not be presumed to be benign.”

    Editor’s Note: This article was updated on March 6, 2023, to reflect updated data.

    PERSPECTIVE

    BACK TO TOP Alice H. Lichtenstein, DSc)

    Alice H. Lichtenstein, DSc

    The outcome of long-term consumption of a keto-style diet likely depends on the type of foods — hence, the type of fat — that predominates.

    If animal fat — meat and milk fat — predominates, high in saturated fat, it is not surprising the researchers reported a positive association with elevated CVD risk.

    Given LDL cholesterol levels were higher, that is likely the case in this study. If a person decides to follow a keto-style diet and gets their fats predominantly from plant sources, high in unsaturated fat such as plant oils — soybean, canola, corn, olive, nuts and seeds — it is very possible the results will be different.

    There is a paper that recently came out in Diabetes Care in patients with type 2 diabetes that supports this premise (Hu Y, et al. Diabetes Care. 2023;doi:10.2337/dc22-2310).

    Alice H. Lichtenstein, DSc

    Gershoff Professor of Nutrition Science and Policy

    Director and Senior Scientist, Cardiovascular Nutrition Laboratory

    Tufts University

    JM USDA Human Nutrition Research Center on Aging

    Disclosures: Lichtenstein reports no relevant financial disclosures.

  • RED YEAST RICE

    Red Yeast Rice: What You Need To Know (based on the NIH march 2023)

    Many are taking Red Yeast Rice under the impression this is a safe product. It may lower your cholesterol but he adverse effects seem to be as much as Lovastatin since it contains the same compound as Lovastatin which is a. drug for cholesterol and the same risks for equivalent doses

    What is red yeast rice?

    Red yeast rice is produced by fermentation of a yeast on rice. The yeast is usually Monascus purpureus.

    Depending on the yeast strain used and the conditions of fermentation, the yeast can enrich the rice with substances known as monacolins, including monacolin K. Monacolin K is structurally identical to the medicine lovastatin.

    Lovastatin, like other statin drugs, helps slow the production of cholesterol in the body to decrease the amount of cholesterol that may build up on the walls of arteries and block blood flow to the heart, brain, and other parts of the body. Statin drugs are used together with diet, weight loss, and exercise to reduce the risk of heart attack and stroke.

    Red yeast rice comes in the forms of food, traditional Chinese medicinedietary supplements, and other products.

    How much monacolin K is in red yeast rice?

    Traditional red yeast rice may contain trace amounts of monacolin K (lovastatin).

    Some commercial red yeast rice products contain very little or no detectable monacolin K. Other products, however, have been found to contain large amounts of monacolin K. Some researchers reported that commercial lovastatin is illegally added to some red yeast rice products.

    It’s impossible for consumers to know the amount of monacolin K in red yeast rice products. Levels of monacolin K and lovastatin are not usually included on product labels. A 2017 review analyzed 28 brands of red yeast rice products from mainstream retailers in the United States, and none of the products included the quantity of monacolin K on the label. Monacolin K was not detected in two brands, and in the 26 brands that contained monacolin K, the quantity ranged more than 60-fold, from 0.09 to 5.48 mg per 1,200 mg of red yeast rice.

    How does the U.S. Food and Drug Administration (FDA) regulate red yeast rice products?

    According to the FDA, red yeast rice products that have enhanced or added lovastatin—which is structurally identical to monacolin K—cannot be marketed as a dietary supplement in the United States. This regulation is based on the FDA’s approval of lovastatin as a new drug before it was ever marketed as a food or dietary supplement.

    On several occasions, the FDA sent warning letters to companies selling red yeast rice products that had enhanced or added lovastatin, telling the companies to correct their violations.

    Are red yeast rice products effective?

    Red yeast rice products that have considerable amounts of monacolin K may effectively lower blood cholesterol levels, blood glucose levels, and blood pressure. They may also reduce the risk of heart problems and death in people with metabolic syndrome. (Metabolic syndrome, also called insulin resistance syndrome, is a group of conditions that raise the risk of heart disease, diabetes, and stroke.) But, because of the levels of monacolin K, these products are considered by the FDA to be unapproved new drugs and are not sold legally in the United States.

    Other red yeast rice products may contain very little monacolin K, and it’s unknown if these products are effective in reducing cholesterol levels or improving other areas of health. Some products have levels of monacolin K that are below the level known to lower cholesterol in clinical trials.

    Are red yeast rice products safe?

    A 2019 systematic review of clinical trials suggested that red yeast rice products with varying levels of monacolin K were safe. But that went against the opinion of the European Food Safety Authority (EFSA), published in 2018, which concluded that exposure to monacolin K from red yeast rice products could lead to severe side effects. The EFSA panel could not identify a guaranteed safe dietary level of monacolins from red yeast rice products.

    What are possible side effects from red yeast rice products?

    Red yeast rice products that contain significant amounts of monacolin K can have the same potential side effects as statin drugs, including muscle, kidney, and liver damage. They may also cause digestive problems (such as diarrhea, nausea, and stomach pain) and other reported side effects.

    Red yeast rice products can have the same types of drug interactions as statin drugs and therefore may interfere with certain medicines or increase the chance for side effects.

    Are there other safety concerns with red yeast rice products?

    Yes. Some red yeast rice products contain a contaminant called citrinin, which is toxic and can damage the kidneys.

    In a 2021 analysis of 37 red yeast rice products, only one had citrinin levels below the maximum level currently set by the European Union. Also, four products that were contaminated with citrinin were labeled as “citrinin-free.”

    Are red yeast rice products safe during pregnancy?

    There are no studies on the safety of red yeast rice products during pregnancy or while breastfeeding. Red yeast rice products are not recommended for those who are pregnant or lactating.

    For More Information

    NCCIH Clearinghouse

    The NCCIH Clearinghouse provides information on NCCIH and complementary and integrative health approaches, including publications and searches of Federal databases of scientific and medical literature. The Clearinghouse does not provide medical advice, treatment recommendations, or referrals to practitioners.

    Toll-free in the U.S.: 1-888-644-6226

    Telecommunications relay service (TRS): 7-1-1

    Website: https://www.nccih.nih.gov

    Email: info@nccih.nih.gov(link sends email)

    Know the Science

    NCCIH and the National Institutes of Health (NIH) provide tools to help you understand the basics and terminology of scientific research so you can make well-informed decisions about your health. Know the Science features a variety of materials, including interactive modules, quizzes, and videos, as well as links to informative content from Federal resources designed to help consumers make sense of health information.

    Explaining How Research Works (NIH)

    Know the Science: 9 Questions To Help You Make Sense of Health Research

    Understanding Clinical Studies (NIH)

    National Heart, Lung, and Blood Institute (NHLBI)

    The NHLBI Health Information Center provides information to health professionals, patients, and the public about heart, lung, and blood diseases and sleep disorders and accepts orders for publications.

    P.O. Box 30105
    Bethesda, MD 20824-0105

    Toll-free in the U.S.: 1-877-NHLBI4U (1-877-645-2448)

    Website: https://www.nhlbi.nih.gov

    Email: nhlbiinfo@nhlbi.nih.gov(link sends email)

    Office of Dietary Supplements (ODS), National Institutes of Health (NIH)

    ODS seeks to strengthen knowledge and understanding of dietary supplements by evaluating scientific information, supporting research, sharing research results, and educating the public. Its resources include publications (such as Dietary Supplements: What You Need To Know) and fact sheets on a variety of specific supplement ingredients and products (such as vitamin D and multivitamin/mineral supplements).

    Website: https://ods.od.nih.gov

    Email: ods@nih.gov(link sends email)

    PubMed®

    A service of the National Library of Medicine, PubMed® contains publication information and (in most cases) brief summaries of articles from scientific and medical journals. For guidance from NCCIH on using PubMed, see How To Find Information About Complementary Health Approaches on PubMed.

    Website: https://pubmed.ncbi.nlm.nih.gov/

    Research Portfolio Online Reporting Tools Expenditures & Res

  • HEALTHY AND OBESE

    ‘Metabolically Healthy Obesity’ Rising, but Still Uncommon

    March 9, 2023

    Trends in the Prevalence of Metabolically Healthy Obesity Among US Adults, 1999-2018

    Jiang-Shui Wang, MBBS1Peng-Fei Xia, MBBS1Meng-Nan Ma, MBBS1et alYue Li, MBBS1Ting-Ting Geng, PhD1Yan-Bo Zhang, PhD1Zhou-Zheng Tu, MBBS1Limiao Jiang, PhD1Li-Rong Zhou, MD2Bing-Fei Zhang, MD2Wen-Wei Tong, RN2Zhilei Shan, PhD3Gang Liu, PhD3Kun Yang, MD2An Pan, PhD1

    Author Affiliations Article Information

    JAMA Netw Open. 2023;6(3):e232145. doi:10.1001/jamanetworkopen.2023.2145

    Key Points

    Question  Has the prevalence of metabolically healthy obesity (MHO) changed among US adults in the past 20 years?

    Findings  In this survey study of 20 430 adults using data from the 1999-2018 National Health and Nutrition Examination Survey cycles, the age-standardized prevalence of MHO increased significantly from 3% in 1999-2002 to 7% in 2015-2018; the proportion of MHO among adults with obesity also increased significantly from 11% to 15%. Disparities existed in trends across sociodemographic subgroups.

    Meaning  The results of this study suggest that the prevalence of MHO among US adults with obesity has increased significantly in the past 2 decades, with variations across sociodemographic subgroups.

    Abstract

    Importance  Improved understanding of trends in the proportion of individuals with metabolically healthy obesity (MHO) may facilitate stratification and management of obesity and inform policy efforts.

    Objectives  To characterize trends in the prevalence of MHO among US adults with obesity, overall and by sociodemographic subgroups.

    Design, Setting, and Participants  This survey study included 20 430 adult participants from 10 National Health and Nutrition Examination Survey (NHANES) cycles between 1999-2000 and 2017-2018. The NHANES is a series of cross-sectional and nationally representative surveys of the US population conducted continuously in 2-year cycles. Data were analyzed from November 2021 to August 2022.

    Exposures  National Health and Nutrition Examination Survey cycles from 1999-2000 to 2017-2018.

    Main Outcomes and Measures  Metabolically healthy obesity was defined as a body mass index of 30.0 (calculated as weight in kilograms divided by height in meters squared) without any metabolic disorders in blood pressure, fasting plasma glucose (FPG), high-density lipoprotein cholesterol (HDL-C), or triglycerides based on established cutoffs. Trends in the age-standardized prevalence of MHO were estimated using logistic regression analysis.

    Results  This study included 20 430 participants. Their weighted mean (SE) age was 47.1 (0.2) years; 50.8% were women, and 68.8% self-reported their race and ethnicity as non-Hispanic White. The age-standardized prevalence (95% CI) of MHO increased from 3.2% (2.6%-3.8%) in the 1999-2002 cycles to 6.6% (5.3%-7.9%) in the 2015-2018 cycles (P < .001 for trend). There were 7386 adults with obesity. Their weighted mean (SE) age was 48.0 (0.3) years, and 53.5% were women. The age-standardized proportion (95% CI) of MHO among these 7386 adults increased from 10.6% (8.8%-12.5%) in the 1999-2002 cycles to 15.0% (12.4%-17.6%) in the 2015-2018 cycles (P = .02 for trend). Substantial increases in the proportion of MHO were observed for adults aged 60 years or older, men, non-Hispanic White individuals, and those with higher income, private insurance, or class I obesity. In addition, there were significant decreases in the age-standardized prevalence (95% CI) of elevated triglycerides (from 44.9% [40.9%-48.9%] to 29.0% [25.7%-32.4%]; P < .001 for trend) and reduced HDL-C (from 51.1% [47.6%-54.6%] to 39.6% [36.3%-43.0%]; P = .006 for trend). There was also a significant increase in elevated FPG (from 49.7% [95% CI, 46.3%-53.0%] to 58.0% [54.8%-61.3%]; P < .001 for trend) but no significant change in elevated blood pressure (from 57.3% [53.9%-60.7%] to 54.0% [50.9%-57.1%]; P = .28 for trend).

    Conclusions and Relevance  The findings of this cross-sectional study suggest that the age-standardized proportion of MHO increased among US adults from 1999 to 2018, but differences in trends existed across sociodemographic subgroups. Effective strategies are needed to improve metabolic health status and prevent obesity-related complications in adults with obesity.

    Introduction

    The prevalence of obesity has increased substantially in the past 2 decades, reaching an epidemic level in the US.1 Obesity is associated with most cardiovascular risk factors, including metabolic syndrome (MetS), hypertension, type 2 diabetes, and dyslipidemia.2 However, large interindividual heterogeneity in the development of obesity-related complications has been suggested.3

     Despite increased body fat, a subset of people with obesity do not have obesity-related cardiometabolic abnormalities; this is referred to as metabolically healthy obesity (MHO).49 Individuals with MHO have favorable metabolic profiles and thus relatively lower risk for adverse cardiovascular consequences of obesity compared with individuals with metabolically unhealthy obesity (MUO).4,10 Evidence suggests that weight management strategies are more effective among individuals with MUO compared with those with MHO,11,12 indicating the potential value of the concept of obesity phenotypes.

    Previous studies have reported on the proportion of US adults with MHO; however, the estimated prevalence of MHO varies widely across studies, partly due to large discrepancies in definitions.4,5,1316 Most studies have used body mass index (BMI) to define obesity status and MetS components to reflect metabolically healthy status, but the cutoff values and number of parameters vary considerably. In recent years, researchers have proposed a strict definition of MHO as the absence of all MetS components in individuals with obesity, based on the rationale that patients with known cardiometabolic risk factors cannot be regarded as healthy.17,18 Evidence from a meta-analysis10 and prospective studies1921 supports the comparable cardiovascular risk of MHO under this definition to that of metabolically healthy individuals with normal weight. Furthermore, insulin resistance and low-grade chronic inflammation, which provide additional information on metabolic health, have also been suggested as potential markers to assess MHO status.9,10,22 In the context of the obesity epidemic, better understanding of trends in MHO may facilitate the stratification and treatment of patients with obesity and inform policy efforts. However, whether the proportion of MHO, defined by conventional risk factors and other surrogate markers, has changed over the past 2 decades is largely unknown for US adults.

    In this study, we aimed to characterize trends in the prevalence of MHO among US adults with obesity from 1999 to 2018, overall and in key sociodemographic subgroups. Our secondary objective was to compare trends in MHO under several commonly used criteria.

    Methods

    Study Population

    The National Health and Nutrition Examination Survey (NHANES) is a serial, cross-sectional, national survey with a complex, stratified, multistage probability design to monitor the health status of the civilian US population. The NHANES has been conducted continuously in 2-year cycles since 1999. Details of the NHANES are described elsewhere.23 The NHANES was approved by the research ethics review board of the US Centers for Disease Control and Prevention (CDC) National Center for Health Statistics, and written informed consent was obtained from all adult participants.23 The Institutional Review Board of Tongji Medical College determined that this study was exempt from review given the use of deidentified data. This study followed the American Association for Public Opinion Research (AAPOR) reporting guideline.

    We used data from 10 NHANES cycles between 1999-2000 and 2017-2018. The response rate decreased from 76% in 1999-2000 to 49% in 2017-2018. We included nonpregnant adults aged 20 years or older in the fasting subsample, whose blood samples were obtained after an overnight fast of at least 8 hours (eTable 1 in Supplement 1). The fasting subsample was included because fasting glucose level is a key component of the MHO definition. Individuals who did not fulfill the fasting criteria or had missing values for BMI or metabolic parameters of interest were excluded.

    Data Collection

    Information on participant age, sex, race and ethnicity, education, income, insurance status, medical history, and medication use was collected through household questionnaires. Race and ethnicity was not consistently reported in the NHANES (eg, Hispanic participants were not oversampled before 2007 and non-Hispanic Asian participants were not classified until 2011).24 For consistency over time, we categorized participants as self-reported Mexican American, non-Hispanic Black, non-Hispanic White, or other race and ethnicity (eg, non-Hispanic Asian or multiple). The family income-to-poverty ratio reflected annual family income relative to the federal poverty threshold and was used as a measure of income classified into 3 groups (≤100%, 101%-399%, and ≥400%).25

    Weight, height, waist circumference, and blood pressure (BP) were measured at mobile examination centers by trained staff according to standardized procedures.23 Body mass index was calculated as weight in kilograms divided by height in meters squared. Three BP measurements were assessed, and systolic BP and diastolic BP were calculated as the mean of all available measurements.

    Participants were asked to provide blood samples at the mobile examination centers. The samples were stored at −20 °C and sent to central laboratories to determine lipid, plasma glucose, serum insulin, and C-reactive protein levels following standard protocols.23 A subset of participants were randomly selected to attend the morning session after an overnight fast; triglycerides, fasting plasma glucose (FPG), and insulin were measured for those who fasted at least 8 hours. Insulin resistance was assessed with the homeostasis model assessment score.26 Although there were changes in the laboratories, methods, and instruments used to measure lipid levels,27 all laboratories participated in the CDC Lipids Standardization Program,28 thus ensuring the accuracy, precision, and comparability of lipid measurements across cycles. To account for changes in laboratory methods over time, we calibrated FPG and serum insulin measurements to early cycles using the recommended backward equations.23

    MHO and MUO Criteria

    Obesity and abdominal obesity were defined as a BMI of 30.0 or more and a waist circumference of 102 cm or more for men and 88 cm or more for women. The ethnicity-specific BMI cutoff for non-Hispanic Asian individuals was not used due to the lack of classification of this subgroup in the NHANES before 2011.24 Metabolic health was defined according to the harmonized definition proposed by Lavie et al17 and Ortega et al.18 Adults with obesity were classified as having MHO if they had 0 of 4 MetS components29,30: (1) elevated BP (systolic BP ≥130 mm Hg, diastolic BP ≥85 mm Hg, or antihypertensive medication use); (2) elevated FPG (≥100 mg/dL [to convert to millimoles per liter, multiply by 0.0555] or antidiabetic medication use); (3) reduced high-density lipoprotein cholesterol (HDL-C) (<40 mg/dL for men and <50 mg/dL for women [to convert to millimoles per liter, multiply by 0.0259]); or (4) elevated triglycerides (≥150 mg/dL [to convert to millimoles per liter, multiply by 0.0113]). Waist circumference was excluded for collinearity with BMI. Since data for cholesterol medication were available only for general use but not for treatment of elevated triglycerides or reduced HDL-C specifically, we did not utilize this information to avoid overestimation of these components, consistent with previous reports on MetS.31 Participants with obesity who met any of the above criteria were classified as having MUO.

    Statistical Analysis

    We first evaluated trends in the prevalence of obesity, MUO, and MHO among all study participants from 1999 to 2018. Prevalence estimates were age standardized to the 2000 US Census population, using 3 age groups (20-39, 40-59, and ≥60 years) by the direct method. To calculate the number of individuals with obesity, MUO, or MHO, we next multiplied age-standardized prevalence estimates by the total noninstitutionalized adult population for each NHANES cycle.32 Trends in MHO proportion and individual metabolic indicators among those with obesity were then evaluated overall and by age group, sex, race and ethnicity, education level, income-to-poverty ratio, home ownership, and health insurance type. Proportion estimates were age standardized to all nonpregnant adults with obesity in the 2015-2018 NHANES cycles, using the same 3 age groups. To improve the reliability and precision of weighted estimates, 2 adjacent cycles were combined in consideration of the low prevalence of MHO. Linear trends over time were evaluated using logistic regression after regressing MHO on survey cycles (modeled as a continuous independent variable). Factors associated with metabolic health among adults with obesity were further identified with logistic regression models, adjusting for age group, sex, and race and ethnicity.

    The complex survey design factors for the NHANES, including sample weights, clustering, and stratification, were accounted for as specified in the NHANES statistical analysis guideline.24 We used morning fasting subsample weights in all analyses to produce estimates representative of the US population. Standard errors were estimated with Taylor series linearization. Complete case analysis was applied if the missing data level for analyses was 10% or less. Several sensitivity analyses were conducted to evaluate the impact of different criteria on MHO trends. First, information on self-reported cholesterol medication use was also used to define MUO and MHO. Second, individuals with a previous diagnosis of cardiovascular disease (CVD) were regarded as having MUO, regardless of their metabolic status.33 Third, abdominal obesity was used as a surrogate of general obesity in the definitions of MHO and MUO. Finally, other definitions commonly used by previous studies based on MetS components,29,30 insulin resistance,4 or together with inflammation5,6 were used to define metabolic health (eTable 2 in Supplement 1).

    All analyses were performed with SAS, version 9.4 (SAS Institute Inc). Two-sided P < .05 was considered statistically significant. Adjustment for multiple comparisons was not performed as in previous reports,1,34 and the results should be interpreted as exploratory due to the potential for type I error. Statistical analyses were conducted from November 2021 to August 2022.

    Results

    This survey study included 20 430 NHANES participants with a weighted mean (SE) age of 47.1 (0.2) years; 50.8% were women and 49.2% were men. In terms of race and ethnicity, 8.2% participants self-identified as Mexican American, 10.8% as non-Hispanic Black, 68.8% as non-Hispanic White, and 12.3% as other race or ethnicity (eTable 3 in Supplement 1). Data on education, income-to-poverty ratio, home ownership, and health insurance were missing for 0.1%, 7.3%, 1.0%, and 0.6% of participants. Analyses of trends in MHO proportion and individual metabolic indicators were restricted to 7386 adults with obesity. Their weighted mean (SE) age was 48.0 (0.3) years; 53.5% were women and 46.5% were men. From the 1999-2002 to 2015-2018 cycles, the proportions of participants with some college education or more, government insurance, or higher-class obesity increased (Table 1).

    Trends in MHO Prevalence Among the Population With Obesity

    For the whole study population, the age-standardized prevalence (95% CI) of obesity increased significantly from 28.6% (26.3%-30.9%) in the 1999-2002 cycles to 40.9% (37.9%-43.8%) in the 2015-2018 cycles (P < .001 for trend). The age-standardized prevalence (95% CI) of MUO also increased from 25.4% (23.3%-27.6%) in 1999-2002 to 34.3% (31.6%-36.9%) in 2015-2018 (P < .001 for trend). Finally, the prevalence (95% CI) of MHO increased from 3.2% (2.6%-3.8%) in 1999-2002 to 6.6% (5.3%-7.9%) in 2015-2018 (P < .001 for trend; Figure 1A).

    Within racial and ethnic subgroups, more than 40% of Mexican American adults and non-Hispanic Black adults in the 2015-2018 cycles had MUO; however, the prevalence of MHO was low among all racial and ethnic subpopulations (eTable 4 in Supplement 1). In the 2015-2018 cycles, an estimated 81.1 million US adults (95% CI, 74.7-87.4) had MUO and 15.6 million (12.5-18.6) had MHO (eFigure 1 in Supplement 1).

    Among the 7386 participants with obesity, the age-standardized proportion (95% CI) of MHO increased significantly from 10.6% (8.8%-12.5%) in the 1999-2002 cycles to 15.0% (12.4%-17.6%) in the 2015-2018 cycles (P = .02 for trend; Figure 1B). A substantial increase was observed among individuals aged 60 years or older, men, and non-Hispanic White adults as well as those with higher income, private insurance, or class I obesity (all P < .05 for trend; Table 2). However, this increase was largely attributable to an increase between the 1999-2002 and 2003-2006 cycles. When trends from the 2003-2006 to 2015-2018 cycles were evaluated, there was no significant increase in the age-standardized proportion of MHO (Table 2).

    Trends in Individual Metabolic Indicators Among the Population With Obesity

    During the past 2 decades, there was a substantial divergence in trends for clinical metabolic indicators among individuals with obesity. From the 1999-2002 to 2015-2018 cycles, significantly decreasing trends in the age-standardized percentage (95% CI) of elevated triglycerides (from 44.9% [40.9%-48.9%] to 29.0% [25.7%-32.4%]; P < .001 for trend) and reduced HDL-C (from 51.1% [47.6%-54.6%] to 39.6% [36.3%-43.0%]; P = .006 for trend) were observed. However, no significant trend in the percentage of elevated BP (from 57.3% [95% CI, 53.9%-60.7%] to 54.0% [50.9%-57.1%]; P = .28 for trend) was observed, whereas the percentage of elevated FPG increased significantly (from 49.7% [46.3%-53.0%] to 58.0% [54.8%-61.3%]; P < .001 for trend; Figure 2).

    Factors Associated With Metabolic Health Among the Population With Obesity

    Among all US participants with obesity in the 1999-2018 NHANES cycles, younger adults, women, non-Hispanic Black individuals, and those with some college education or more, higher income, home ownership, or lower obesity class were generally more likely to be metabolically healthy (Table 3). Women with obesity were more likely to have reduced HDL-C but less likely to have elevated BP, FPG, and triglycerides compared with men with obesity. Non-Hispanic Black individuals with obesity were more likely to have elevated BP but less likely to have elevated triglycerides and reduced HDL-C compared with non-Hispanic White adults with obesity.

    Sensitivity Analysis

    When individuals who used cholesterol medication or had a previous CVD diagnosis were further classified as having MUO, the proportions of MHO among adults with obesity were slightly smaller because more individuals were classified into the metabolically unhealthy group (eTables 5 and 6 in Supplement 1). Trends in metabolically healthy abdominal obesity generally followed the same patterns as observed for MHO, albeit with more notable changes (eTable 7 in Supplement 1). Sample sizes for some sensitivity analyses under other MHO criteria were somewhat smaller due to missing values for certain variables. In the 2015-2018 NHANES cycles, the age-standardized prevalence (95% CI) of MHO in the total population varied from 3.5% (2.5%-4.4%) to 18.1% (16.1%-20.2%) when using other MHO definitions, and the proportion of MHO among the population with obesity varied from 8.0% (6.0%-9.9%) to 42.4% (39.6%-45.1%) (eFigure 2 and eTable 8 in Supplement 1). There were increasing trends in the prevalence of MHO under other criteria based on MetS components. However, decreasing trends were observed when insulin resistance was used to define metabolic health. Trends in age-standardized mean concentrations of all individual metabolic parameters among adults with obesity, MUO, and MHO are shown in eTable 9 in Supplement 1.

    Discussion

    The results of this nationally representative survey study suggest that the age-standardized prevalence of obesity, MUO, and MHO increased significantly among US adults from 1999 to 2018. The proportion of MHO among adults with obesity and its trends varied across different criteria. When defined as the absence of all MetS components, the proportion of MHO increased significantly from 10.6% in 1999-2002 to 15.0% in 2015-2018. However, this increase was largely due to an increase between 1999-2002 and 2003-2006, and disparities existed among sociodemographic subgroups. Our results suggest that the overall increase in MHO was driven primarily by the decrease in dyslipidemia (ie, elevated triglycerides and reduced HDL-C) among adults with obesity; however, elevated BP remained stable and elevated FPG increased during the past 2 decades.

    Different MHO criteria used in previous studies have led to large discrepancies in estimates of MHO prevalence, which precludes direct comparisons among studies. Previous reviews reported that the proportion of MHO among the population with obesity ranged between 6% and 40%, depending on the criteria used.7,8,33From a clinical and public health point of view, we used strict criteria based on BMI and MetS components to define MHO in our main analyses.17,18 Our estimates of MHO prevalence among US adults (range, 3.2%-6.6% across years) and MHO proportion among the population with obesity (range, 10.6%-15.0%) were consistent with previous reports using the same criteria.14,15 One study based on 2009-2016 NHANES data reported a smaller proportion of MHO (6.8%), mainly because the investigators used 120/80 mm Hg as the cut point for elevated BP.13 Unsurprisingly, our estimates were lower than those in studies with looser MHO criteria46; however, research has shown that most studies have overestimated the prevalence of MHO.3,33 Large heterogeneity in MHO prevalence estimates using different definitions underscores the need to establish a standardized definition of this obesity phenotype.

    We have reported, to our knowledge, the most recent and comprehensive national trend estimates of MHO. The observation that MHO proportions increased from 1999 to 2018 should be treated with caution, as trends between the 2003-2006 and 2015-2018 cycles were relatively stable. These results may be better interpreted when combined with trends in individual metabolic indicators. For example, the overall increase in MHO may be driven primarily by the decrease in dyslipidemia among the population with obesity, which has also been observed for the population overall.27,35 A plausible explanation may include increased awareness, diagnosis, and treatment of dyslipidemia as well as decreased smoking, removal of trans-fatty acids from foods, and improved diet quality.27,36,37 In contrast, the plateau in the proportion of MHO from 2003-2006 to 2015-2018 may result from a combination of leveling off of reduced HDL-C, no significant change in elevated BP, and the significant increase in elevated FPG over the same period. Previous studies examining trends in cardiovascular health metrics among US adults with obesity have reported the following: decreases for untreated hypertension and untreated dyslipidemia between 1999 and 201038; nonsignificant changes in elevated BP and improvements in mean HDL-C, but deteriorations in mean hemoglobin A1c between 1988 and 201437; and increases in the proportion of individuals without prior cardiovascular events or cardiometabolic diseases between 1999 and 2016.39 Although different time periods may contribute to variations in trend estimates, our results were generally consistent with these findings. Given the complex interplay between obesity and glucose control, greater attention should be paid to the increase in elevated FPG among adults with obesity.40 Beyond conventional risk factors, our study further complemented a recent study on trends in metabolic phenotypes defined by MetS components by incorporating insulin resistance and chronic inflammation to capture a wider breadth of metabolic abnormalities.16 It is noteworthy that the use of insulin resistance to define poor metabolic health mitigated or even reversed the overall increasing trends in MHO, which may be linked to an increase in sedentary time, waist circumference, and nonalcoholic fatty liver disease.4143 Although reasons for these trends may be complex and warrant further investigation, these results highlight the importance of reinforcing glucose management and reducing insulin resistance among adults with obesity.

    The overall increase in the proportion of MHO should also be treated in the context of existing disparities in subpopulations. Among racial and ethnic subgroups, we observed a significant increase in the proportion of MHO only in non-Hispanic White adults, which may be attributed in part to higher income, wider insurance coverage, more accessible health services, sociocultural differences, and other social determinants.4446 Previous studies have suggested that higher-income groups tend to have improved diet quality,36 increased adherence to physical activity guidelines,43 and decreased smoking prevalence,25 which may contribute to favorable trends in the proportion of MHO. In contrast, adults with lower levels of education or lower income were more likely to be metabolically unhealthy; this is important to note given their already higher prevalence of obesity and lack of weight self-awareness.47,48 The disproportionate prevalence of and trends in metabolic alterations could aggravate obesity disparities, as these are all CVD risk factors; thus, these findings underscore the urgency for more accessible strategies to reach racial and ethnic minority individuals and those residing in low-income communities.

    Although there is no consensus on the protective effect of MHO compared with metabolically healthy normal weight,10,49,50 accumulating evidence suggests that individuals with MHO have a better CVD prognosis than their MUO counterparts.12,17,33 Previous studies suggest that mechanisms including visceral and ectopic fat accumulation, adipose dysfunction, insulin resistance, inflammatory dysregulation, and gut microbiota may play a part.33,51 However, MHO has been considered a transitory state for most individuals with obesity, and those whose status converts to MUO would have higher risk.9,22 Therefore, detailed and repeated metabolic phenotyping among adults with obesity should be taken into consideration in clinical risk assessment to improve the inherent shortcomings of BMI assessment and to help those with MHO maintain their status.8 It should also be emphasized that although the proportion of MHO increased in this study, the absolute number of adults with MUO has increased dramatically in the past 2 decades, suggesting that MUO is still a major health concern. Effective strategies to address the double burden of obesity and metabolic disorders and to curb the increase in MUO are important.

    Limitations

    This survey study has several limitations. First, there is no universally accepted definition of MHO; thus, we provided estimates under several commonly used criteria. Second, misclassification of MHO was possible because metabolic parameters such as glycemic levels and lipids were measured only once, particularly considering the transient nature of MHO.22 Third, we did not evaluate physical activity, cardiovascular fitness, and body fat distribution due to inconsistent or lacking assessments across survey cycles, which might be important in understanding the metabolic health status of individuals with obesity.9,49 Fourth, the response rate declined across surveys. Finally, although 2 adjacent NHANES cycles were combined, there was a possibility of insufficient power to detect variabilities over time, particularly in some subgroups with limited sample size.

    Conclusions

    In this cross-sectional study of US adults, we observed a low prevalence of MHO and a large, increasing burden of MUO. Although the proportion of MHO among adults with obesity increased during the past 2 decades, disparities among sociodemographic subpopulations were observed. These results highlight the need for effective strategies to optimize metabolic status and prevent obesity-related complications among people with obesity, especially among vulnerable subpopulations. Priority should be placed on reinforcing glucose management and reducing insulin resistance among individuals with obesity.

    Back to top

    Article Information

    Accepted for Publication: January 23, 2023.

    Published: March 9, 2023. doi:10.1001/jamanetworkopen.2023.2145

    Open Access: This is an open access article distributed under the terms of the CC-BY License. © 2023 Wang JS et al. JAMA Network Open.

    Corresponding Authors: An Pan, PhD, Ministry of Education Key Laboratory of Environment and Health, Department of Epidemiology and Biostatistics, School of Public Health, Tongji Medical College, Huazhong University of Science and Technology, Wuhan, Hubei 430030, China (panan@hust.edu.cn); Kun Yang, MD, Department of Endocrinology, Affiliated Dongfeng Hospital, Hubei University of Medicine, Shiyan, Hubei 442001, China (1732310370@qq.com).

    Author Contributions: Mr Wang had full access to all of the data in the study and takes responsibility for the integrity of the data and the accuracy of the data analysis. Mr Wang and Mr Xia contributed equally to this work.

    Concept and design: Wang, Xia, Pan.

    Acquisition, analysis, or interpretation of data: All authors.

    Drafting of the manuscript: Wang, Xia.

    Critical revision of the manuscript for important intellectual content: All authors.

    Statistical analysis: Wang, Xia, Ma.

    Obtained funding: Pan.

    Administrative, technical, or material support: Yang, Pan.

    Supervision: Ma, Shan, Liu, Yang, Pan.

    Conflict of Interest Disclosures: None reported.

    Funding/Support: This study was supported by grants 81930124 and 82021005 from the National Natural Science Foundation of China, grants 2021GCRC075 and 2021GCRC076 from the Fundamental Research Funds for the Central Universities, and grant 2017SHZDZX01 from the Shanghai Municipal Science and Technology Major Projects.

    Role of the Funder/Sponsor: The funders had no role in the design and conduct of the study; collection, management, analysis, and interpretation of the data; preparation, review, or approval of the manuscript; and decision to submit the manuscript for publication.

    Data Sharing Statement: See Supplement 2.

    References

    1.

    Hales  CM, Carroll  MD, Fryar  CD, Ogden  CL. Prevalence of obesity and severe obesity among adults: United States, 2017-2018. NCHS Data Brief. 2020;(360):1-8.

    2.

    Kotsis  V, Jordan  J, Micic  D,  et al.  Obesity and cardiovascular risk: a call for action from the European Society of Hypertension Working Group of Obesity, Diabetes and the High-risk Patient and European Association for the Study of Obesity: part A: mechanisms of obesity induced hypertension, diabetes and dyslipidemia and practice guidelines for treatment.   J Hypertens. 2018;36(7):1427-1440. doi:10.1097/HJH.0000000000001730 PubMedGoogle ScholarCrossref

    3.

    Neeland  IJ, Poirier  P, Després  JP.  Cardiovascular and metabolic heterogeneity of obesity: clinical challenges and implications for management.   Circulation. 2018;137(13):1391-1406. doi:10.1161/CIRCULATIONAHA.117.029617 PubMedGoogle ScholarCrossref

    4.

    Meigs  JB, Wilson  PWF, Fox  CS,  et al.  Body mass index, metabolic syndrome, and risk of type 2 diabetes or cardiovascular disease.   J Clin Endocrinol Metab. 2006;91(8):2906-2912. doi:10.1210/jc.2006-0594 PubMedGoogle ScholarCrossref

    5.

    Wildman  RP, Muntner  P, Reynolds  K,  et al.  The obese without cardiometabolic risk factor clustering and the normal weight with cardiometabolic risk factor clustering: prevalence and correlates of 2 phenotypes among the US population (NHANES 1999-2004).   Arch Intern Med. 2008;168(15):1617-1624. doi:10.1001/archinte.168.15.1617 
    ArticlePubMedGoogle ScholarCrossref

    6.

    Karelis  AD, Rabasa-Lhoret  R.  Inclusion of C-reactive protein in the identification of metabolically healthy but obese (MHO) individuals.   Diabetes Metab. 2008;34(2):183-184. doi:10.1016/j.diabet.2007.11.004 PubMedGoogle ScholarCrossref

    7.

    Primeau  V, Coderre  L, Karelis  AD,  et al.  Characterizing the profile of obese patients who are metabolically healthy.   Int J Obes (Lond). 2011;35(7):971-981. doi:10.1038/ijo.2010.216 PubMedGoogle ScholarCrossref

    8.

    Phillips  CM.  Metabolically healthy obesity: definitions, determinants and clinical implications.   Rev Endocr Metab Disord. 2013;14(3):219-227. doi:10.1007/s11154-013-9252-x PubMedGoogle ScholarCrossref

    9.

    Stefan  N, Häring  HU, Hu  FB, Schulze  MB.  Metabolically healthy obesity: epidemiology, mechanisms, and clinical implications.   Lancet Diabetes Endocrinol. 2013;1(2):152-162. doi:10.1016/S2213-8587(13)70062-7 PubMedGoogle ScholarCrossref

    10.

    Eckel  N, Meidtner  K, Kalle-Uhlmann  T, Stefan  N, Schulze  MB.  Metabolically healthy obesity and cardiovascular events: a systematic review and meta-analysis.   Eur J Prev Cardiol. 2016;23(9):956-966. doi:10.1177/2047487315623884 PubMedGoogle ScholarCrossref

    11.

    Soll  D, Gawron  J, Pletsch-Borba  L, Spranger  J, Mai  K.  Long-term impact of the metabolic status on weight loss-induced health benefits.   Nutr Metab (Lond). 2022;19(1):25. doi:10.1186/s12986-022-00660-w PubMedGoogle ScholarCrossref

    12.

    Stefan  N, Häring  HU, Schulze  MB.  Metabolically healthy obesity: the low-hanging fruit in obesity treatment?   Lancet Diabetes Endocrinol. 2018;6(3):249-258. doi:10.1016/S2213-8587(17)30292-9 PubMedGoogle ScholarCrossref

    13.

    Araújo  J, Cai  J, Stevens  J.  Prevalence of optimal metabolic health in American adults: National Health and Nutrition Examination Survey 2009-2016.   Metab Syndr Relat Disord. 2019;17(1):46-52. doi:10.1089/met.2018.0105 PubMedGoogle ScholarCrossref

    14.

    Smith  GI, Mittendorfer  B, Klein  S.  Metabolically healthy obesity: facts and fantasies.   J Clin Invest. 2019;129(10):3978-3989. doi:10.1172/JCI129186 PubMedGoogle ScholarCrossref

    15.

    Adair  KE, Bowden  RG, Funderburk  LK, Forsse  JS, Ylitalo  KR.  Metabolic health, obesity, and renal function: 2013-2018 National Health and Nutrition Examination Surveys.   Life (Basel). 2021;11(9):888. doi:10.3390/life11090888 PubMedGoogle ScholarCrossref

    16.

    Liu  J, Zhang  Y, Lavie  CJ, Moran  AE.  Trends in metabolic phenotypes according to body mass index among US adults, 1999-2018.   Mayo Clin Proc. 2022;97(9):1664-1679. doi:10.1016/j.mayocp.2022.02.013 PubMedGoogle ScholarCrossref

    17.

    Lavie  CJ, Laddu  D, Arena  R, Ortega  FB, Alpert  MA, Kushner  RF.  Healthy weight and obesity prevention: JACC Health Promotion Series.   J Am Coll Cardiol. 2018;72(13):1506-1531. doi:10.1016/j.jacc.2018.08.1037 PubMedGoogle ScholarCrossref

    18.

    Ortega  FB, Lavie  CJ, Blair  SN.  Obesity and cardiovascular disease.   Circ Res. 2016;118(11):1752-1770. doi:10.1161/CIRCRESAHA.115.306883 PubMedGoogle ScholarCrossref

    19.

    Lassale  C, Tzoulaki  I, Moons  KGM,  et al.  Separate and combined associations of obesity and metabolic health with coronary heart disease: a pan-European case-cohort analysis.   Eur Heart J. 2018;39(5):397-406. doi:10.1093/eurheartj/ehx448 PubMedGoogle ScholarCrossref

    20.

    Zembic  A, Eckel  N, Stefan  N, Baudry  J, Schulze  MB.  An empirically derived definition of metabolically healthy obesity based on risk of cardiovascular and total mortality.   JAMA Netw Open. 2021;4(5):e218505. doi:10.1001/jamanetworkopen.2021.8505 
    ArticlePubMedGoogle ScholarCrossref

    21.

    Al-Khalidi  B, Kimball  SM, Kuk  JL, Ardern  CI.  Metabolically healthy obesity, vitamin D, and all-cause and cardiometabolic mortality risk in NHANES III.   Clin Nutr. 2019;38(2):820-828. doi:10.1016/j.clnu.2018.02.025 PubMedGoogle ScholarCrossref

    22.

    Kouvari  M, Panagiotakos  DB, Yannakoulia  M,  et al; ATTICA Study Investigators.  Transition from metabolically benign to metabolically unhealthy obesity and 10-year cardiovascular disease incidence: the ATTICA cohort study.   Metabolism. 2019;93:18-24. doi:10.1016/j.metabol.2019.01.003 PubMedGoogle ScholarCrossref

    23.

    National Center for Health Statistics. National Health and Nutrition Examination Survey. US Centers for Disease Control and Prevention. Accessed April 18, 2022. https://www.cdc.gov/nchs/nhanes/index.htm

    24.

    National Center for Health Statistics. NHANES survey methods and analytic guidelines. US Centers for Disease Control and Prevention. Accessed April 1, 2022. https://wwwn.cdc.gov/nchs/nhanes/analyticguidelines.aspx

    25.

    Odutayo  A, Gill  P, Shepherd  S,  et al.  Income disparities in absolute cardiovascular risk and cardiovascular risk factors in the United States, 1999-2014.   JAMA Cardiol. 2017;2(7):782-790. doi:10.1001/jamacardio.2017.1658 
    ArticlePubMedGoogle ScholarCrossref

    26.

    Matthews  DR, Hosker  JP, Rudenski  AS, Naylor  BA, Treacher  DF, Turner  RC.  Homeostasis model assessment: insulin resistance and beta-cell function from fasting plasma glucose and insulin concentrations in man.   Diabetologia. 1985;28(7):412-419. doi:10.1007/BF00280883 PubMedGoogle ScholarCrossref

    27.

    Rosinger  A, Carroll  MD, Lacher  D, Ogden  C.  Trends in total cholesterol, triglycerides, and low-density lipoprotein in US adults, 1999-2014.   JAMA Cardiol. 2017;2(3):339-341. doi:10.1001/jamacardio.2016.4396 
    ArticlePubMedGoogle ScholarCrossref

    28.

    US Centers for Disease Control and Prevention. LSP: Lipids Standardization Program. Accessed February 1, 2022. https://www.cdc.gov/labstandards/lsp.html

    29.

    Alberti  KG, Eckel  RH, Grundy  SM,  et al; International Diabetes Federation Task Force on Epidemiology and Prevention; National Heart, Lung, and Blood Institute; American Heart Association; World Heart Federation; International Atherosclerosis Society; International Association for the Study of Obesity.  Harmonizing the metabolic syndrome: a joint interim statement of the International Diabetes Federation Task Force on Epidemiology and Prevention; National Heart, Lung, and Blood Institute; American Heart Association; World Heart Federation; International Atherosclerosis Society; and International Association for the Study of Obesity.   Circulation. 2009;120(16):1640-1645. doi:10.1161/CIRCULATIONAHA.109.192644 PubMedGoogle ScholarCrossref

    30.

    Expert Panel on Detection, Evaluation, and Treatment of High Blood Cholesterol in Adults.  Executive summary of the third report of the National Cholesterol Education Program (NCEP) Expert Panel on Detection, Evaluation, and Treatment of High Blood Cholesterol in Adults (Adult Treatment Panel III).   JAMA. 2001;285(19):2486-2497. doi:10.1001/jama.285.19.2486 
    ArticlePubMedGoogle ScholarCrossref

    31.

    Aguilar  M, Bhuket  T, Torres  S, Liu  B, Wong  RJ.  Prevalence of the metabolic syndrome in the United States, 2003-2012.   JAMA. 2015;313(19):1973-1974. doi:10.1001/jama.2015.4260 
    ArticlePubMedGoogle ScholarCrossref

    32.

    National Center for Health Statistics. National Health and Nutrition Examination Survey: NHANES response rates and population totals. Accessed August 27, 2022. https://wwwn.cdc.gov/nchs/nhanes/responserates.aspx

    33.

    Blüher  M.  Metabolically healthy obesity.   Endocr Rev. 2020;41(3):405-420. doi:10.1210/endrev/bnaa004 PubMedGoogle ScholarCrossref

    34.

    Cao  J, Zhang  S.  Multiple comparison procedures.   JAMA. 2014;312(5):543-544. doi:10.1001/jama.2014.9440 
    ArticlePubMedGoogle ScholarCrossref

    35.

    O’Hearn  M, Lauren  BN, Wong  JB, Kim  DD, Mozaffarian  D.  Trends and disparities in cardiometabolic health among U.S. adults, 1999-2018.   J Am Coll Cardiol. 2022;80(2):138-151. doi:10.1016/j.jacc.2022.04.046 PubMedGoogle ScholarCrossref

    36.

    Shan  Z, Rehm  CD, Rogers  G,  et al.  Trends in dietary carbohydrate, protein, and fat intake and diet quality among US adults, 1999-2016.   JAMA. 2019;322(12):1178-1187. doi:10.1001/jama.2019.13771 
    ArticlePubMedGoogle ScholarCrossref

    37.

    Guo  F, Garvey  WT.  Trends in cardiovascular health metrics in obese adults: National Health and Nutrition Examination Survey (NHANES), 1988-2014.   J Am Heart Assoc. 2016;5(7):e3619. doi:10.1161/JAHA.116.003619 PubMedGoogle ScholarCrossref

    38.

    Saydah  S, Bullard  KM, Cheng  Y,  et al.  Trends in cardiovascular disease risk factors by obesity level in adults in the United States, NHANES 1999-2010.   Obesity (Silver Spring). 2014;22(8):1888-1895. doi:10.1002/oby.20761 PubMedGoogle ScholarCrossref

    39.

    Chelliah  P, Li  X, Adams-Huet  B, Lingvay  I.  Trends in the prevalence of cardiometabolic disease and cardiovascular events by body mass index category in adults from 1999 to 2016.   Postgrad Med J. 2020;96(1141):655-659. doi:10.1136/postgradmedj-2020-137749 PubMedGoogle ScholarCrossref

    40.

    Scheen  AJ, Van Gaal  LF.  Combating the dual burden: therapeutic targeting of common pathways in obesity and type 2 diabetes.   Lancet Diabetes Endocrinol. 2014;2(11):911-922. doi:10.1016/S2213-8587(14)70004-X PubMedGoogle ScholarCrossref

    41.

    Younossi  ZM, Stepanova  M, Younossi  Y,  et al.  Epidemiology of chronic liver diseases in the USA in the past three decades.   Gut. 2020;69(3):564-568. doi:10.1136/gutjnl-2019-318813 PubMedGoogle ScholarCrossref

    42.

    Stefan  N, Häring  HU.  The metabolically benign and malignant fatty liver.   Diabetes. 2011;60(8):2011-2017. doi:10.2337/db11-0231 PubMedGoogle ScholarCrossref

    43.

    Du  Y, Liu  B, Sun  Y, Snetselaar  LG, Wallace  RB, Bao  W.  Trends in adherence to the physical activity guidelines for Americans for aerobic activity and time spent on sedentary behavior among US adults, 2007 to 2016.   JAMA Netw Open. 2019;2(7):e197597. doi:10.1001/jamanetworkopen.2019.7597 
    ArticlePubMedGoogle ScholarCrossref

    44.

    He  J, Zhu  Z, Bundy  JD, Dorans  KS, Chen  J, Hamm  LL.  Trends in cardiovascular risk factors in us adults by race and ethnicity and socioeconomic status, 1999-2018.   JAMA. 2021;326(13):1286-1298. doi:10.1001/jama.2021.15187 
    ArticlePubMedGoogle ScholarCrossref

    45.

    Wang  L, Li  X, Wang  Z,  et al.  Trends in prevalence of diabetes and control of risk factors in diabetes among US adults, 1999-2018.   JAMA. 2021;326(8):1-13. doi:10.1001/jama.2021.9883 
    ArticlePubMedGoogle ScholarCrossref

    46.

    Min  J, Goodale  H, Xue  H, Brey  R, Wang  Y.  Racial-ethnic disparities in obesity and biological, behavioral, and sociocultural influences in the United States: a systematic review.   Adv Nutr. 2021;12(4):1137-1148. doi:10.1093/advances/nmaa162 PubMedGoogle ScholarCrossref

    47.

    Ogden  CL, Fakhouri  TH, Carroll  MD,  et al.  Prevalence of obesity among adults, by household income and education—United States, 2011-2014.   MMWR Morb Mortal Wkly Rep. 2017;66(50):1369-1373. doi:10.15585/mmwr.mm6650a1 PubMedGoogle ScholarCrossref

    48.

    Kwak  YE, McMillan  R, McDonald  EK  IV.  Trends in overweight and obesity self-awareness among adults with overweight or obesity in the United States, 1999 to 2016.   Ann Intern Med. 2021;174(5):721-723. doi:10.7326/M20-3882 PubMedGoogle ScholarCrossref

    49.

    Ortega  FB, Cadenas-Sanchez  C, Migueles  JH,  et al.  Role of physical activity and fitness in the characterization and prognosis of the metabolically healthy obesity phenotype: a systematic review and meta-analysis.   Prog Cardiovasc Dis. 2018;61(2):190-205. doi:10.1016/j.pcad.2018.07.008 PubMedGoogle ScholarCrossref

    50.

    Opio  J, Croker  E, Odongo  GS, Attia  J, Wynne  K, McEvoy  M.  Metabolically healthy overweight/obesity are associated with increased risk of cardiovascular disease in adults, even in the absence of metabolic risk factors: a systematic review and meta-analysis of prospective cohort studies.   Obes Rev. 2020;21(12):e13127. doi:10.1111/obr.13127 PubMedGoogle ScholarCrossref

    51.

    Iacobini  C, Pugliese  G, Blasetti Fantauzzi  C, Federici  M, Menini  S.  Metabolically healthy versus metabolically unhealthy obesity.   Metabolism. 2019;92:51-60. doi:10.1016/j.metabol.2018.11.009 PubMedGoogle ScholarCrossref

    Miriam E. Tucker

    March 09, 2023

    9

    10

    “We observed a low prevalence of [metabolically healthy obesity] and a large, increasing burden of [metabolically unhealthy obesity]….These results highlight the need for effective strategies to…prevent obesity-related complications among people with obesity, especially among vulnerable subpopulations,” say Jiang-Shui Wang, MBBS, of Huazhong University of Science and Technology, Wuhan, China, and colleagues, who published their findings March 9, 2023, in JAMA Network Open. 

    • 9
  • MIND DIET for Alzheimer’s

    Diet Review: MIND Diet harvard nutrition website. 2023 March

    Overhead View of Fresh Omega-3 Rich Foods: A variety of healthy foods like fish, nuts, seeds, fruit, vegetables, and oil

    Finding yourself confused by the seemingly endless promotion of weight-loss strategies and diet plans? In this series, we take a look at some popular diets—and review the research behind them.

    What Is It?

    The Mediterranean-DASH Diet Intervention for Neurodegenerative Delay, or MIND diet, targets the health of the aging brain. Dementia is the sixth leading cause of death in the United States, driving many people to search for ways to prevent cognitive decline. In 2015, Dr. Martha Clare Morris and colleagues at Rush University Medical Center and the Harvard Chan School of Public Health published two papers introducing the MIND diet. [1,2] Both the Mediterranean and DASH diets had already been associated with preservation of cognitive function, presumably through their protective effects against cardiovascular disease, which in turn preserved brain health.

    The research team followed a group of older adults for up to 10 years from the Rush Memory and Aging Project (MAP), a study of residents free of dementia at the time of enrollment. They were recruited from more than 40 retirement communities and senior public housing units in the Chicago area. More than 1,000 participants filled out annual dietary questionnaires for nine years and had two cognitive assessments. A MIND diet score was developed to identify foods and nutrients, along with daily serving sizes, related to protection against dementia and cognitive decline. The results of the study produced fifteen dietary components that were classified as either “brain healthy” or as unhealthy. Participants with the highest MIND diet scores had a significantly slower rate of cognitive decline compared with those with the lowest scores. [1] The effects of the MIND diet on cognition showed greater effects than either the Mediterranean or the DASH diet alone.

    How It Works

    The purpose of the research was to see if the MIND diet, partially based on the Mediterranean and DASH diets, could directly prevent the onset or slow the progression of dementia. All three diets highlight plant-based foods and limit the intake of animal and high saturated fat foods. The MIND diet recommends specific “brain healthy” foods to include, and five unhealthy food items to limit.

    The healthy items the MIND diet guidelines suggest include:

    The unhealthy items, which are higher in saturated and trans fat, include:

    • Less than 5 servings a week of pastries and sweets
    • Less than 4 servings a week of red meat (including beef, pork, lamb, and products made from these meats)
    • Less than one serving a week of cheese and fried foods
    • Less than 1 tablespoon a day of butter/stick margarine

    Sample meal plan

    This sample meal plan is roughly 2000 calories, the recommended intake for an average person. If you have higher calorie needs, you may add an additional snack or two; if you have lower calorie needs, you may remove a snack. If you have more specific nutritional needs or would like assistance in creating additional meal plans, consult with a registered dietitian. 

    Breakfast: 1 cup cooked steel-cut oats mixed with 2 tablespoons slivered almonds, ¾ cup fresh or frozen blueberries, sprinkle of cinnamon


    Snack: 1 medium orange


    Lunch:

    • Beans and rice – In medium pot, heat 1 tbsp olive oil. Add and sauté ½ chopped onion, 1 tsp cumin, and 1 tsp garlic powder until onion is softened. Mix in 1 cup canned beans, drained and rinsed. Serve bean mixture over 1 cup cooked brown rice.
    • 2 cups salad (e.g., mixed greens, cucumbers, bell peppers) with dressing (mix together 2 tbsp olive oil, 1 tbsp lemon juice or vinegar, ½ teaspoon Dijon mustard, ½ teaspoon garlic powder, ¼ tsp black pepper)

    Snack: ¼ cup unsalted mixed nuts


    Dinner:

    • 3 ounces baked salmon brushed with same salad dressing used at lunch
    • 1 cup chopped steamed cauliflower
    • 1 whole grain roll dipped in 1 tbsp olive oil

    Is alcohol part of the MIND diet?

    Wine was included as one of the 15 original dietary components in the MIND diet score, in which a moderate amount was found to be associated with cognitive health. [1] However, in subsequent MIND trials it was omitted for “safety” reasons. [9] The effect of alcohol on an individual is complex, so that blanket recommendations about alcohol are not possible. Based on one’s unique personal and family history, alcohol offers each person a different spectrum of benefits and risks. Whether or not to include alcohol is a personal decision that should be discussed with your healthcare provider. For more information, read Alcohol: Balancing Risks and Benefits.

    The Research So Far

    The MIND diet contains foods rich in certain vitamins, carotenoids, and flavonoids that are believed to protect the brain by reducing oxidative stress and inflammation. Researchers found a 53% lower rate of Alzheimer’s disease for those with the highest MIND scores. Even those participants who had moderate MIND scores showed a 35% lower rate compared with those with the lowest MIND scores. [2] The results didn’t change even after adjusting for factors associated with dementia including healthy lifestyle behaviors, cardiovascular-related conditions (e.g., high blood pressure, stroke, diabetes), depression, and obesity, supporting the conclusion that the MIND diet was associated with the preservation of cognitive function.

    Although the aim of the MIND diet was on brain health, it may also benefit heart health, diabetes, and certain cancers because it includes components of the Mediterranean and DASHdiets, which have been shown to lower the risk of these diseases.

    Additional published studies and ongoing trials review the potential benefits of the MIND diet:

    • A higher MIND diet score as shown by higher intake of foods on the MIND diet was associated with better cognitive functioning and slower cognitive decline in a cohort of adults 65 and older, even when accounting for those with Alzheimer’s disease and other brain diseases. [3]
    • When comparing the highest to lowest MIND diet scores in a cohort of participants with a history of stroke, those with the highest scores had a slower rate of cognitive decline after almost 6 years of follow-up. [4]
    • Researchers following a cohort of Puerto Rican adults ages 45-75 living in Boston, Massachusetts, found after 8 years that those with the highest MIND diet scores had better cognitive function than those with the lowest scores. They also observed that greater poverty and less education were strongly associated with lower MIND diet scores and lower cognitive function. [5]
    • Researchers following a cohort of Australian adults ages 60-64 years followed for 12 years found that the group with the highest MIND diet scores had 53% lower odds of developing cognitive impairment than those with the lowest scores. [6]
    • Researchers following 2,092 participants from the Framingham Heart Study found that higher MIND diet scores were associated with better cognitive function and memory, and larger total brain volume. However, the diet was not associated with slower rates of cognitive decline. [7]
    • A prospective cohort study of more than 16,000 women ages 70 and over from the Nurses’ Health Study found that longer-term adherence to the MIND diet was moderately associated with higher memory scores in later life. [8]
    • A three-year randomized controlled multicenter trial funded by the National Institute on Aging from the National Institutes of Health is studying the effects of a MIND diet intervention on cognitive decline. [9] It is following 604 older participants to compare the effects of either the MIND diet with mild caloric restriction or a usual diet with mild caloric restriction on cognitive function. Various biochemical markers of dementia and inflammation will be measured in all participants.
    • clinical trial from John’s Hopkins University aims to compare the effects of a modified Atkins diet with the MIND diet on cognition and specific gene levels related to Alzheimer’s disease.

    Potential Pitfalls

    • The MIND diet is flexible in that it does not include rigid meal plans. However, this also means that people will need to create their own meal plans and recipes based on the foods recommended on the MIND diet. This may be challenging for those who do not cook. Those who eat out frequently may need to spend time reviewing restaurant menus.
    • Although the diet plan specifies daily and weekly amounts of foods to include and not include, it does not restrict the diet to eating only these foods. It also does not provide meal plans or emphasize portion sizes or exercise.

    Bottom Line 

    The MIND diet can be a healthful eating plan that incorporates dietary patterns from the Mediterranean and DASH, both of which have suggested benefits in preventing and improving cardiovascular disease and diabetes, and supporting healthy aging. When used in conjunction with a balanced plate guide, the diet may also promote healthy weight loss if desired. More research needs to be done to extend the MIND studies in other populations, and clinical trials are ongoing to prove that the MIND diet reduces cognitive decline that occurs with aging.

  • FRYING FOOD AND CANCER

    If you’re trying to lose weight, you may already be telling your waiter to hold the fries. Now there’s another health benefit you can reap: Cutting down on certain fried foods can also help you cut down on the amount of acrylamide you eat. That’s a good thing because high levels of acrylamide have been found to cause cancer in animals, and on that basis scientists believe it is likely to cause cancer in humans as well.

    FDA chemist Lauren Robin explains that acrylamide is a chemical that can form in some foods—mainly plant-based foods—during high-temperature cooking processes like frying and baking. These include potatoes, cereals, coffee, crackers or breads, dried fruits and many other foods. According to the Grocery Manufacturers Association, acrylamide is found in 40 percent of the calories consumed in the average American diet.

    While acrylamide has probably been around as long as people have been baking, roasting, toasting or frying foods, it was only in 2002 that scientists first discovered the chemical in food. Since then, the FDA has been actively investigating the effects of acrylamide as well as potential measures to reduce it. On March 1, 2016, the FDA posted a final documentwith practical strategies to help growers, manufacturers and food service operators lower the amount of acrylamide in foods associated with higher levels of the chemical.

    In addition, there are a number of steps you and your family can take to cut down on the amount of acrylamide in the foods you eat.

    Acrylamide forms from sugars and an amino acid that are naturally present in food. It does not form, or forms at lower levels, in dairy, meat and fish products. The formation occurs when foods are cooked at home and in restaurants as well as when they are made commercially.

    Generally speaking, acrylamide is more likely to accumulate when cooking is done for longer periods or at higher temperatures,” Robin says. Boiling and steaming foods do not typically form acrylamide.

    Tips for Cutting Down on Acrylamide

    Given the widespread presence of acrylamide in foods, it isn’t feasible to completely eliminate acrylamide from one’s diet, Robin says. Nor is it necessary. Removing any one or two foods from your diet would not have a significant effect on overall exposure to acrylamide.

    However, here are some steps you can take to help decrease the amount of acrylamide that you and your family consume:

    • Frying causes acrylamide formation. If frying frozen fries, follow manufacturers’ recommendations on time and temperature and avoid overcooking, heavy crisping or burning.
    • Toast bread to a light brown color rather than a dark brown color. Avoid very brown areas.
    • Cook cut potato products such as frozen french fries to a golden yellow color rather than a brown color. Brown areas tend to contain more acrylamide.
    • Do not store potatoes in the refrigerator, which can increase acrylamide during cooking. Keep potatoes outside the refrigerator in a dark, cool place, such as a closet or a pantry.

    FDA also recommends that you adopt a healthy eating plan, consistent with the Dietary Guidelines for Americans, that:

    • Emphasizes fruits, vegetables, whole grains, and fat-free or low-fat milk and milk products;
    • Includes lean meats, poultry, fish, beans, eggs, and nuts; and
    • Limits saturated fats, trans fats, cholesterol, salt (sodium) and added sugars.

    back to top

    FDA. 2016

    https://www.fda.gov/consumers/consumer-updates/you-can-help-cut-acrylamide-your-diet

  • SAVE THE PLANET WITH A VEGAN DIET


    A vegan diet is the least impactful on the climate compared to other popular diets, according to a new study published in The American Journal of Clinical Nutrition. The study, which compared popular diets on both nutrition quality and environmental impact, also found that keto diet and paleo diet score among the lowest on overall nutrition quality and were among the highest on carbon emissions.

    The study compiled diet quality scores using data from more than 16,000 adult diets collected by the Centers for Disease Control and Prevention’s National Health and Nutrition Examination Survey. Individual diets were assigned point values based on the federal Healthy Eating Index and average scores were calculated for those eating each type of diet. While other researchers have examined the nutritional impact of keto and paleo diets, this is the first study to measure the carbon footprints of each diet, as consumed by American adults, and compare them to other common diets, according to the study’s senior author, Diego Rose, professor and nutrition program director at Tulane University School of Public Health and Tropical Medicine. In a first-of-its-kind study has compared the carbon footprints of six of the most common diets.

    It’s well-known that around a third of greenhouse gas emissions come from the food system, and that beef production is one of the biggest culprits – emitting around 10 times more gases than chicken

    vegan diet was found to be the least impactful on climate, generating 0.7 kg of carbon dioxide per 1,000 calories consumed, less than a quarter of the impact of the keto diet. The vegan diet was followed by vegetarian and pescatarian diets in increasing impact.

    “Climate change is arguably one of the most pressing problems of our time, and a lot of people are interested in moving to a plant-based diet,” said Professor Diego Rose, senior author of the Tulane University study which also weighs up different diets’ nutritional quality.

    Based on the nutritional values of the diets analyzed, the vegan and vegetarian diets scored highest on nutritional quality behind the pescatarian diet.

    Keto- diets- worst for the Planet

    On the other end of the spectrum, the study found that the keto diet, which prioritizes high amounts of fat and low amounts of carbs, was estimated to generate almost 3 kg of carbon dioxide for every 1,000 calories consumed. The paleo diet, which eschews grains and beans in favor of meats, nuts, and vegetables, received the next lowest diet quality score and also had a high carbon footprint, at 2.6 kg of carbon dioxide per 1,000 calories. 

    “We suspected the negative climate impacts because they’re meat-centric, but no one had really compared all these diets—as they are chosen by individuals, instead of prescribed by experts— to each other using a common framework,” Rose said in a statement.

    The omnivore diet—the most common diet, represented by 86 percent of survey participants— sat squarely in the middle of the pack of both quality and sustainability. Based on the findings, if a third of those on omnivore diets began eating a vegetarian diet, on average for any given day, it would be equivalent to eliminating 340 million passenger vehicle miles. those on omnivorous diets opted for plant-forward diets such as the Mediterranean or meat-limiting DASH diets, both carbon footprints and nutritional quality scores improved.

    “Climate change is arguably one of the most pressing problems of our time, and a lot of people are interested in moving to a plant- based diet,” Rose said. “Based on our results, that would reduce your footprint and be generally healthy.”

    One third of all gas emissions from the food system

    A 2021 United Nations-backed study found that 34 percent of greenhouse gas emissions come from the food system. The major share of those emissions come from food production, with beef being responsible for eight to 10 times more emissions than chicken production and over 20 times more emissions than nut and legume production.

    While the environmental impacts of specific foods have been studied extensively, Rose said this study was important because “it considers how individuals select popular diets that are composed of a wide variety of foods.” Going forward, Rose still has questions about how to encourage eating habits that are better for people and the planet. “I think the next question is, ‘How would different policies affect outcomes and how could those move us toward healthier, more environmentally friendly diets?’” Rose said.

  • Uncontrolled BP twice as likely in Black vs. white women with hypertension

    Black women aged 20 to 50 years with hypertension are more than twice as likely to have uncontrolled BP compared with white women, independent of social determinants of health and modifiable health behaviors, researchers reported.

    In an analysis of more than 1,200 women who participated in the National Health and Nutrition Examination Survey, researchers also found that food insecurity was highly prevalent among Black and Hispanic women of childbearing age with hypertension, further increasing risk for maternal morbidity during and after pregnancy.

    Black women aged 20 to 50 years with hypertension are more than twice as likely to have uncontrolled BP vs. white women, independent of social determinants of health and modifiable health behaviors.

    “Although high blood pressure is a treatable, common chronic health condition, it is a leading cause of pregnancy-related deaths and severe disease,” Lara C. Kovell, MD, a cardiologist at the University of Massachusetts Chan Medical School in Worcester, said in a press release. “The United States has much higher rates of pregnancy-related deaths than economically similar countries, and Black women are disproportionately affected.”

    Kovell and colleagues analyzed data from 1,293 women aged 20 to 50 years with a diagnosis of hypertension, defined as a BP of at least 140/90 mm Hg (mean age, 36 years), who participated in NHANES between 2001 and 2018. Researchers assessed social determinants of health and BP control by race, estimating the odds of uncontrolled BP by race and ethnicity before and after adjusting for social determinants of health, health factors and modifiable health behaviors. Researchers assessed food insecurity via responses to questions about hunger and affording food. 

    The findings were published in the Journal of the American Heart Association.

    Within the cohort, 59.2% identified as white, 23.4% identified as Black, 15.8% identified as Hispanic and 1.7% identified as Asian.

    After adjusting for social determinants of health, health factors and modifiable health behaviors, Black women were 2.3 times more likely to have uncontrolled BP compared with white women (OR = 2.31; 95% CI, 1.08-4.92). There were no differences in uncontrolled BP rates when comparing white women with Asian and Hispanic women. 

    Black and Hispanic women had higher rates of food insecurity (32% and 25%, respectively) than white women (13%; P < .001).

    “Food insecurity is important when thinking about high blood pressure, since sodium levels are higher in many lower-cost food options such as canned, ultra-processed fast foods,” Kovell said in the release. “Moreover, food insecurity and a lack of access to healthy foods have been shown in other studies to increase the risk of high blood pressure.”

    In the release, Kovell said questions about food insecurity and health care access should be included in the standard screening questions at hospital or clinic visits, especially for pregnant patients. 

    Reference:

  • 500 EXTRA STEPS

    Fact checked byRichard Smith

    Source/Disclosures

    500 extra steps per day could reduce cardiovascular risk for adults 70 years and older ( APPROX QUARTER MILE)

    For every 500 extra steps per day, or an additional one-quarter mile walked, adults aged 70 years or older could reduce risk for a CVD event by approximately 14%, a speaker reported.

    The results of a substudy from the ARIC cohort were presented at the American Heart Association’s Epidemiology, Prevention, Lifestyle & Cardiometabolic Health Scientific Sessions 2023.

    Steps are an easy way to measure physical activity, and more daily steps were associated with a lower risk of having a cardiovascular disease-related event in older adults,” Erin E. Dooley, PhD, assistant professor of epidemiology at the University of Alabama at Birmingham School of Public Health, said in a press release. “However, most studies have focused on early-to-midlife adults with daily goals of 10,000 or more steps, which may not be attainable for older individuals.”

    To assess whether more daily steps were associated with lower risk for proximal CVD events among older adults, Dooley and colleagues evaluated an ARIC study subgroup of 452 participants who wore an accelerometer (ActiGraph GT3X) on the waist 3 days or more for 10 hours or more per day (mean age, 78.4 years; 59% women; 20% Black). Participants were stratified into quartiles based on daily steps. Outcomes of interest included fatal and nonfatal CVD events, defined as CHD, stroke and HF.

    During 1,269 person-years of follow-up, mean daily step count was 1,796 steps and approximately 7.5% of participants experienced a CVD event.

    Compared with the 3.5% of participants in the highest quartile of daily steps ( 4,453 steps per day), the 11.5% of participants in the lowest quartile of daily steps (< 2,077 steps per day) had higher incidence of cumulative CVD events.

    The speaker reported that every 500 extra steps per day — translating to approximately one-quarter of a mile — was associated with a 14% decreased risk for a CVD event (HR = 0.86; 95% CI, 0.76-0.98).

    Compared with participants in the lowest quartile of daily steps, those in the highest quartile had an approximately 77% decreased risk for a proximal CVD event (HR = 0.23; 95% CI, 0.07-0.83), according to the presentation.

    It’s important to maintain physical activity as we age; however, daily step goals should also be attainable. We were surprised to find that every additional quarter of a mile, or 500 steps, of walking had such a strong benefit to heart health,” Dooley said in the release. “While we do not want to diminish the importance of higher-intensity physical activity, encouraging small increases in the number of daily steps also has significant cardiovascular benefits. If you are an older adult over the age of 70, start with trying to get 500 more steps per day.”

    Reference: